 STOCK MARKET STRATEGY FOR JULY 23, 2018: The stock market has been hovering in a trading range for several weeks now. This choppy action presents only short-term trading opportunities. But rallies from oversold conditions have been producing profitable moves for nimble traders. With that in mind, I have selected what I consider as the four more reliable technical indicators when used together for short-term trading. This change is designed to make decisions easier to make with the understanding that only small & short-term trading positions are being maintained.
Key underlying short-term timing indicators show the following:
***********
THE BOTTOM LINE: The market appears to be at a short-term top and it is time to step aside for now. Another short-term upside set-up will take at least another week to develop.
STOCK MARKET STRATEGY FOR JULY 14, 2018: The market presented a tricky, short-term trading opportunity on July 3rd. It came from a semi-oversold condition which suggests that the rally will not be strong. So far, it appears as if the market can still go in either direction with the same degree of certainty. This is a time to be on the sidelines waiting for the next opportunity to set up. The Volatility Indicator will have to traverse across its oscillator from “overbought” to “oversold” which will probably take over a week to happen.
Key underlying short-term timing indicators show the following:
***********
THE BOTTOM LINE: The Fear/Greed Index is currently reading 47 or “neutral.” I’m still awaiting for a quick move into the “Extremely Fear” area in order to feel like the conditions are ripe for a more sustainable rally. So, we continue to wait for a better trading opportunity to the upside.
Categories: Stock Market Strategy Tags: AAPL, buy low sell high, ETF, invest, investing, investing tips, market timing, money, QQQ, stock market timing, stock market trading tips, stock trading tips, stocks, wall street
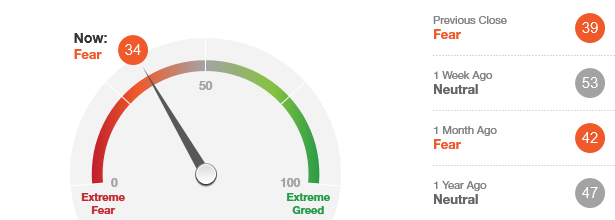 The “Fear/Greed Sentiment Index: What Emotion is Driving the Market Now?” has a current reading of 34 which is in the “Fear” zone. This suggests that the market is within range of a buying opportunity on further weakness.
This indicator has been in the “neutral” area for some time as well as “Fear” and “Greed,” but it has avoided both “Extreme Fear” and “Extreme Greed” readings in past month.
With the internal indicators approaching “oversold” readings, this suggests that a tradable bottom could occur in the coming week to 10 days. While it is uncertain to how powerful a rally might be from here, it probably is worth taking some positions on weakness particularly if it is accompanied by “obvious bad news.”
STOCK MARKET STRATEGY FOR JUNE 17, 2018: Some internal indicators of the stock market are showing “oversold” readings, while others are trending down. This suggests that a short-term bottom could be setting up for later this week. I see this as a quick trading opportunity and may likely come with more bad news on the “trade war” front. The “Volatility Indicator” would have to reach oversold levels before I’d make that move with my trading account.
Key underlying short-term timing indicators show the following:
***********
THE BOTTOM LINE: The Fear/Greed Index is currently reading 61 or “Greed.” This is largely a neutral reading and doesn’t suggest any direction for the stock market at this time. Any moves are likely to be short-term in nature. An intermediate top or bottom does not seem likely in the coming weeks.
STOCK MARKET STRATEGY FOR MAY 19, 2018: The internal indicators of the stock market have been trending down the last few days, chewing up time, and possibly setting itself up for another trading bottom as early as late next week. Another plausible scenario is for next week to produce a bounce with a more stable bottom about two weeks out. In any event, there is nothing to do but wait for the next set-up and that can only happen with a bout of bad news.
Key underlying short-term timing indicators show the following:
***********
THE BOTTOM LINE: The Fear/Greed Index is currently reading 52 or “Neutral.” This doesn’t really tell you anything except that it has probably seen the worst in terms of extreme negative sentiment. One more quick trip to the “Extreme Fear” area will probably be all that it takes for another tradable intermediate term bottom.
Categories: Stock Market Strategy Tags: insurance, investing, investments, money, retirement, stock market, stock market timing, stock trading, stocks, tony robbins, trading, wall street
STOCK MARKET STRATEGY FOR APRIL 28, 2018: The stock market may be setting itself up for an intermediate-term bottom next week. The internal breadth indicators below are all close to oversold readings and additional weakness is sure to trigger buy signals. If a decline next week starts to materialize, then look at it as an opportunity to go long and ignore the “bad news” that has to happen in order to create the public selling. The trick will be if this happens mostly on Friday when it will take more guts to make trading commitments over an uncertain weekend.
Key underlying short-term timing indicators show the following:
***********
THE BOTTOM LINE: The Fear/Greed Index is currently reading 40 or “Fear.” This reading is after it has been in the “Extreme Fear” range for many weeks. I would expect a brief one or two day return to the “Extreme Fear” zone to coincide with a new intermediate buy signal on any weakness next week. If so, this “correction” will have scared enough weak hands out of the long game with only strong hands left to ride the next rally up. Of course, if we rally straight up from here then this scenario goes out the window and the deck will be “shuffled” once again.
Categories: Stock Market Strategy Tags: insurance, investing, investments, money, retirement, stock market, stock market timing, stock trading, stocks, tony robbins, trading, wall street
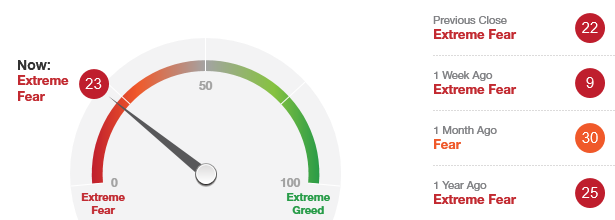 The “Fear/Greed Sentiment Index: What Emotion is Driving the Market Now?” has a current reading of 23 which is in the “Extreme Fear” zone. This suggests that the market is in a buying range and not a selling range. Tactically, this means that you should either buy or hold depending on your situation.
This indicator has remained in the “Extreme Fear” area for an abnormally long time. I would guess that it will leave this “oversold” area shortly and not return for some time. (After perhaps, one more spike down)
I would look to buy on any 2 to 3 day weakness that is accompanied by “obvious bad news” as the cover story for a good bottom in the market. I think that the next retest of the recent bottoms will be successful and that a sharp rally should follow. The only trick will be if the weakness occurs on a Friday where traders will have to sweat out the weekend of potentially more bad news.
Categories: Fear & Greed Index Tags: insurance, investing, investments, money, retirement, stock market, stock market timing, stock trading, stocks, tony robbins, trading, wall street
STOCK MARKET STRATEGY FOR MARCH 25, 2018: The stock market is setting itself up for a climatic bottom over the short-term. Breadth indicators are in “oversold” territory with the chance of become even more oversold if the market should sell-off on Monday-Tuesday. While a market panic is difficult to buy into, it may still be the proper strategy for buying low and selling high. But the proper to tactic would be to buy in smaller increments spread over 3-5 days during periods of weakness. This takes discipline that few amateurs possess.
Key underlying short-term timing indicators show the following:
***********
THE BOTTOM LINE: The Fear/Greed Index is currently reading 7 or “Extreme Fear.” With any weakness on Monday, this indicator will have the lowest reading in several years indicating a potential intermediate term bottom. To spread the risk, a wise trader should buy a combination of diversified broad-based ETFs and strong Blue-Chip dividend-paying stocks (example: Exxon, Microsoft, Apple, Wells Fargo). The first step would be to buy on extreme weakness in small pilot positions and add gradually. If a market panic should occur, it may take a few days for the market to stabilize or bounce. And then there is the possibility of a final wave down which a trader must be anticipate when conditions become so extreme as they are now.
Categories: Uncategorized Tags: insurance, investing, investments, money, retirement, stock market, stock market timing, stock trading, stocks, tony robbins, trading, wall street
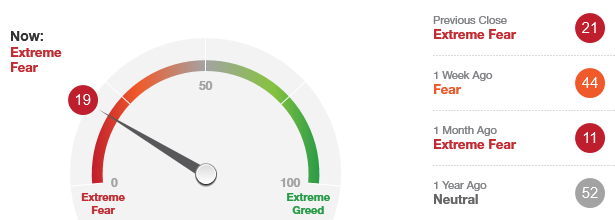 The “Fear/Greed Sentiment Index: What Emotion is Driving the Market Now?” reading has a current reading of 19 which is in the “Extreme Fear” zone. This suggests that the market is in a buying range and not a selling range. Tactically, this means that you should either buy or hold depending on your situation.
This indicator ventured out into the “Fear” area about a week ago, but has returned back into the “Extreme Greed” zone once again. My guess is that this indicator will not stay in the “Extreme Greed” area very long since it has already spent an abnormally long period of time in it last month.
I would look to buy weakness especially if we should receive oversold readings in breadth indicators, moves toward major indexes 200-day moving averages or retests of previous correction lows. While it is hard to say how much higher the general market can go up from here, the important thing to keep in mind is that this market has been correcting for a long enough time to support a healthy multi-month rally.
Categories: Fear & Greed Index Tags: AAPL, AMZN, bonds, EFT, equities, invest, investing, investments, mutual funds, retirement, stock market, stocks, tony robbins, trading, wealth mastery
STOCK MARKET STRATEGY FOR MARCH 10, 2018: The stock market is currently “overbought” in most of the internal indicators. Therefore, the market can hit a short-term top at any time. This has been a very tricky market to trade precisely, since the swings have been so punishing over the short-term when being too early with large bets. The market still has room to rally to the upside. As far as taking new long positions, the time for that was either last week or early February. Now is a time to watch and wait for the next “oversold” set-up.
Key underlying short-term timing indicators show the following:
***********
THE BOTTOM LINE: The Fear/Greed Index is currently reading 44 or “Fear.” This is the first move out of the “Extreme Fear” area in several weeks. As far as sentiment goes, we had our chance over the past month to take long positions on weakness. The thing to do now, is wait for a short-term oversold condition in two the McClellan Oscillators (the most reliable short-term indicators) in order to take new positions for another trip into new high territory.
Categories: Stock Market Strategy Tags: AAPL, AMZN, bonds, EFT, equities, invest, investing, investments, mutual funds, retirement, stock market, stocks, tony robbins, trading, wealth mastery