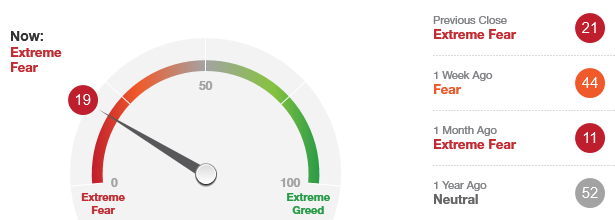
 The “Fear/Greed Sentiment Index: What Emotion is Driving the Market Now?” reading has a current reading of 19 which is in the “Extreme Fear” zone. This suggests that the market is in a buying range and not a selling range. Tactically, this means that you should either buy or hold depending on your situation.
This indicator ventured out into the “Fear” area about a week ago, but has returned back into the “Extreme Greed” zone once again. My guess is that this indicator will not stay in the “Extreme Greed” area very long since it has already spent an abnormally long period of time in it last month.
I would look to buy weakness especially if we should receive oversold readings in breadth indicators, moves toward major indexes 200-day moving averages or retests of previous correction lows. While it is hard to say how much higher the general market can go up from here, the important thing to keep in mind is that this market has been correcting for a long enough time to support a healthy multi-month rally.
Categories: Fear & Greed Index Tags: AAPL, AMZN, bonds, EFT, equities, invest, investing, investments, mutual funds, retirement, stock market, stocks, tony robbins, trading, wealth mastery
 STOCK MARKET STRATEGY FOR MARCH 10, 2018: The stock market is currently “overbought” in most of the internal indicators. Therefore, the market can hit a short-term top at any time. This has been a very tricky market to trade precisely, since the swings have been so punishing over the short-term when being too early with large bets. The market still has room to rally to the upside. As far as taking new long positions, the time for that was either last week or early February. Now is a time to watch and wait for the next “oversold” set-up.
Key underlying short-term timing indicators show the following:
***********
THE BOTTOM LINE: The Fear/Greed Index is currently reading 44 or “Fear.” This is the first move out of the “Extreme Fear” area in several weeks. As far as sentiment goes, we had our chance over the past month to take long positions on weakness. The thing to do now, is wait for a short-term oversold condition in two the McClellan Oscillators (the most reliable short-term indicators) in order to take new positions for another trip into new high territory.
Categories: Stock Market Strategy Tags: AAPL, AMZN, bonds, EFT, equities, invest, investing, investments, mutual funds, retirement, stock market, stocks, tony robbins, trading, wealth mastery
STOCK MARKET STRATEGY FOR JANUARY 15, 2018: Despite the stock market’s historic and relentless rally, it still remains relatively “neutral” in its internal technical position. Only one out of the five that I follow is in the “overbought” area with the reliable “Volatility Indicator” in close range of a buy signal. While this is not an optimal time to “buy low and sell high,” it is most likely a time when there is a rotation of strength and a pause in the advance. I’d still be looking for another short-term oversold condition to create a new buying opportunity to the upside.
Key underlying short-term timing indicators show the following:
***********
THE BOTTOM LINE: The Fear/Greed Index is currently reading “Extreme Greed.” This means that it is not a time to buy and one that you consider selling. I’d be looking for some short-term “bad news” to create a short, sharp drop that will present yet another buying opportunity to the upside. Despite the duration and extent of this rally, it still makes more sense to expect the market to go than go down over the short-to-intermediate term. Trying to guess tops is simply too hard to do with a measure of accuracy when you have a market of this nature.
Categories: Stock Market Strategy Tags: AAPL, AMZN, bonds, EFT, equities, invest, investing, investments, mutual funds, retirement, stock market, stocks, trading
STOCK MARKET STRATEGY FOR DECEMBER 3, 2017: Despite stock market’s historic run-up, it still may have more time to rally. Friday’s 300-point drop may have purged a lot of negativity and weak hands out of the market. The internal indicators are coming off of overbought readings and may be setting itself up for another rally after a brief drop into the traditional December 12-18 time slot. It’s more than likely that any correction of any significance will occur after the New Year.
Key underlying short-term timing indicators show the following:
***********
THE BOTTOM LINE: The Fear/Greed Index is currently reading “Greed” after only one day being in the “Fear” territory. I’d still be looking to go long on any new oversold condition between December 12-18. Consider choppy action as a time to create such an oversold condition and a chance to once again ride up to new all-time highs.
Categories: Stock Market Strategy Tags: AAPL, AMZN, bonds, EFT, equities, invest, investing, investments, mutual funds, retirement, stock market, stocks, trading
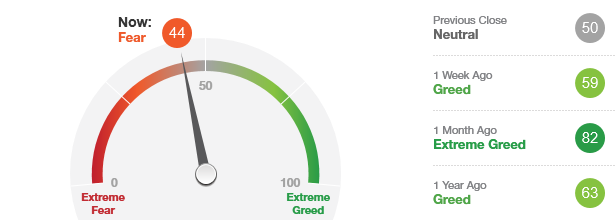
The “Fear/Greed Sentiment Index: What Emotion is Driving the Market Now?” reading has a current reading of 44 which is in the “Fear” zone. This allows the market to go in either direction so it is neither a selling or a buying area.
But this indicator continues to move across its range from “Extreme Greed” readings around 90 just a few weeks ago. Recent buying opportunities have come when this indicator gets a reading of 25 or lower.
Today’s “Fear” reading is the first one in a long time and may be suggesting that an oversold/pessimistic bottom is coming in the next few weeks. That would present a chance to get back onboard the market for another ride up to new highs.
Categories: Fear & Greed Index Tags: AAPL, AMZN, bonds, EFT, equities, invest, investing, investments, mutual funds, retirement, stock market, stocks, trading
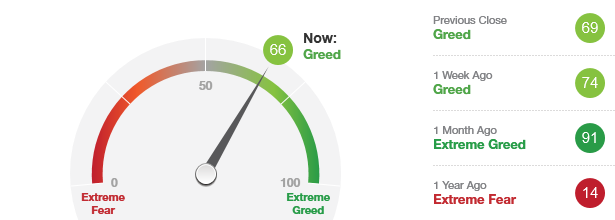
The “Fear/Greed Sentiment Index: What Emotion is Driving the Market Now?” reading has a current reading of 66 which is in the “Greed” zone. This allows the market to go in either direction so it is neither a selling or a buying area.
One might think that the market’s continuing rally has to stop and correct at the very least. But it appears that there are still major portions of the general market that have stayed modest in their appreciation and present opportunities for price advances.
But since this indicator was in the “Extreme Greed” area for a long time, it may be working its way toward the “Extreme Fear” area and a buying opportunity a few weeks away from now.
Categories: Fear & Greed Index Tags: AAPL, AMZN, bonds, EFT, equities, invest, investing, investments, mutual funds, retirement, stock market, stocks, trading
 INCOME-ORIENTED ETF YIELDS FOR FEBRUARY 11, 2012: The current market is still reflecting an increasing tolerance towards risk. Money that has been in money market funds yielding zero and intermediate-term (7-10 year maturities) treasury bonds & notes yielding 2.5% are searching for higher rates of return. All that remains for these conservative investors and institutions is the all-clear signal that the return sufficiently compensates for the risk in lower quality bonds, high dividend paying equities, and high yielding preferred stocks.
The following list is comprised of ETFs that are geared towards income and income plus growth. They are ranked according to their present dividend yield with average daily volume exceeding 1 million shares for maximum liquidity and the most efficient executions.
**********
All of the funds that are mentioned above excluding XLU – Utilities Select Sector SPDR and TLT – Barclay’s 20+ Year Treasury Bond Fund have enjoyed spectacular price runs since last October – November. While their yields may appear attractive, their charts indicate that a correction is overdue in these issues. Bonds and preferred stock are like any asset class and are subject to periods of overvaluation, overbought conditions, and too much optimism from the public. There will be a better time in the future to take positions in these high-yield investments.
**********
“Some investors live or die by earnings reports. Earnings are important, but who knows if the reported earnings are accurate? A clever accountant can make earnings appear good or not so good, depending on the season or objective. There can be no subterfuge about a cash dividend. It is either paid or it is not paid. If it is paid, the shareholder knows that the company is making money. If it is not paid, no rhetoric can disguise the circumstances.”
Geraldine Weiss and Gregory Weiss ~ Authors of The Dividend Connection (1995)
 INCOME-ORIENTED ETF YIELDS FOR JANUARY 27, 2012: The current market is reflecting an increasing tolerance towards risk. Money that has been in money market funds yielding zero and intermediate-term (7-10 year maturities) treasury bonds yielding 2.5% are searching for higher rates of return. All that remains for these conservative investors and institutions is the all-clear signal that the return sufficiently compensates for the risk in lower quality bonds, high dividend paying equities, and high yielding preferred stocks.
The following list is comprised of ETFs that are geared towards income and income plus growth. They are ranked according to their present dividend yield:
- 7.73% JNK – SPDR Lehman High Yield Bond (Average volume=4,590,090)
- 7.69% HYG – iShares High Corporate Bonds (Average volume=2,319,270)
- 7.62% PGF – PowerShares Financial Preferred (Average volume=357,127)
- 6.99% PFF – S&P U.S. Preferred Stock Index (Average volume=1,277,100)
- 6.78% PGX – PowerShares Preferred Portfolio (Average volume=467,321)
- 5.42% CVY – Guggenheim Multi-Asset Income (Average volume=239,577)
- 3.94% XLU – Utilities Select Sector SPDR (Average volume=7,383,240)
- 3.70% PEY – PowerShares High Yield Dividend (Average volume=518,074)
- 3.44% DVY – iShares DJ Select Dividend Index (Average volume=1,849,590)
- 3.30% TLT – Barclays 20+ Year Treasury Bond Fund (Average volume=8,469,930)
- 3.23% SDY – SPDR S&P Dividend Index (Average volume=1,278,950)
- 2.94% VYM – Vanguard High Dividend Yield (Average volume=541,831)
- 2.56% IEF – Barclays 7-10 Year Treasury Bond Fund (Average volume=946,802)
- 2.44% DIA – SPDR Dow Jones Industrial Average (Average volume=7,470,160)
- 2.14% VIG – Vanguard Dividend Appreciation (Average volume=1,342,150)
- 2.05% SPY – SPDR S&P 500 (Average volume=191,876,000)
**********
“Approximately 75% of the companies traded on the New York Stock Exchange pay cash dividends to their shareholders. It is perhaps the most sacred of all corporate financial components and the measure of value we hold in the highest regard.”
Geraldine Weiss and Gregory Weiss ~ Authors of The Dividend Connection (1995)