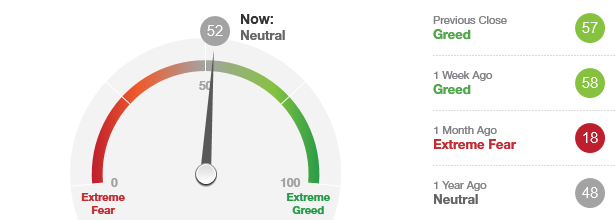
 The “Fear/Greed Sentiment Index: What Emotion is Driving the Market Now?” has a current reading of “52” which is not indicating a nearby top or bottom. Keep in mind that more often than not, the final bottom or ideal buy point occurs when this indicator is below a reading of “10.”
Categories: Fear & Greed Index Tags: invest, investing, investing tips, investments, retirement, SPY, stock action, stock market, stock market timing, stock trading, stock trading tips
 STOCK MARKET STRATEGY FOR SEPTEMBER 7, 2019: The stock market just broke above its most recent tight trading range on optimist news about a possible China trade deal. But the internal indicators suggest that the market is overbought and a correction is due with a possible target low around September 11th – the anniversary of 9/11/2001. This may be a good time to lighten up on positions over the short-term with a decent chance of a hard spike down in the coming week.
Key underlying short-term timing indicators show the following:
***********
THE BOTTOM LINE: The stock market has made a significant rally on obvious good news about a China trade deal. But the overbought condition makes the short-term market one that could be bumpy and volatile. This may be an opportune time to take some profits and be ready for better odds over the shorter term.
Categories: Stock Market Strategy, Stock Market Timing Tags: invest, investing, investing tips, investments, retirement, SPY, stock action, stock market, stock market timing, stock trading, stock trading tips
STOCK MARKET STRATEGY FOR AUGUST 31, 2019: The stock market is currently in a tight trading range with its 4th trip up to the top of it on Friday. With the internal indicators in neutral territory across the board, I’d expect the trading range to continue without a breakout to either the top or bottom in the next few weeks. Don’t be surprised if the rally continues for a few more days on hopes for a trade deal with China only to find disappointment and threats again by next weekend…..and another drop to test the bottom of the range.
Key underlying short-term timing indicators show the following:
***********
THE BOTTOM LINE: The stock market is in the middle of its trading range in terms of the internal indicators. It appears that the market will continue upwards for a few more days before taking another trip to revisit its most recent bottom.
Categories: Stock Market Strategy, Stock Market Timing Tags: invest, investing, investing tips, investments, retirement, SPY, stock action, stock market, stock market timing, stock trading, stock trading tips, stocks