 STOCK MARKET STRATEGY FOR DECEMBER 25, 2018: The stock market gave us one chance to get out on Wednesday morning before the Fed’s announcement. But after the Chairman Powell’s briefing, the market tanked hard on the remainder of Wednesday, Thursday, Friday and Monday of Christmas Eve Day. Needless to say, there was no “Santa Claus Rally” and investors are in total shock mode right now. As the internal indicators show, this is a gradual “crash” up to now and when it finally stops is anyone’s guess.
Key underlying short-term timing indicators show the following:
***********
THE BOTTOM LINE: The Fear/Greed Index is currently reading 2 or “Extreme Fear.” This confirms the action of the internal indicators above and suggests that we are near an internal low for the market. We may get a short and sharp rally soon, but in all likelihood we should see another visit to the established lows. It may take a classic “crash” in order for the market to finally hit bottom and reverse its downward trend. And with the most recent figures, that is going to take an intraday drop exceeding 1000 Dow points which is going to be scary. If I had to guess, I’d say that a rally should start on Friday December 28th after tax-selling season finally ends.
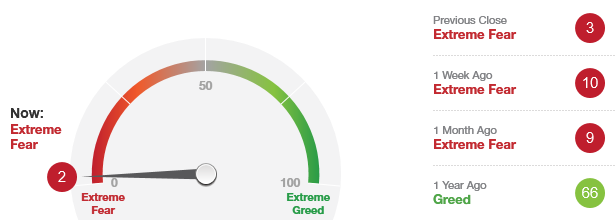 The “Fear/Greed Sentiment Index: What Emotion is Driving the Market Now?” has a current reading of “2” which is the lowest number since this indicator’s inception. This suggests that market sentiment is at levels last seen in the 2008-2009 bear market. However, this doesn’t necessarily mean that the market is ready to go up just now. But what this does do is potentially indicate the location of the “internal bottom” of the market. The “external bottom” or lowest Dow Jones Industrial Average closing price will likely follow 2-5 weeks later. On this second “external bottom” there will be many non-confirmations to show it’s a final bottom. This type of set-up won’t happen until January.
STOCK MARKET STRATEGY FOR DECEMBER 16, 2018: The stock market continued its downward move by closing at its lows for this correction. With the majority of internal indicators showing readings in the 30s, a short-term bottom can be expected on Monday or Tuesday. That should set up the market for its anticipated “Santa Claus Rally.”
Key underlying short-term timing indicators show the following:
***********
THE BOTTOM LINE: The Fear/Greed Index is currently reading 8 or “Extreme Fear.” This single digit reading after two months of “Extreme Fear” readings overall is sufficient to indicate that the general market is unloved and the sentiment has been severe enough it both duration and direction. This sets up the market for a year-end rally starting sometime between Tuesday and Thursday of this week.
Note: Thursday would match the recent 18-day cycle of lows from October 29 to November 23 in terms of number of trading days. Tuesday would mark the matching number of calendar days. Thus, a cyclical low can be anticipated between Tuesday and Thursday of this week. But remember that it will be tricky catching the exact bottom for it may mean trying to catch a “falling knife.”
STOCK MARKET STRATEGY FOR DECEMBER 9, 2018: The stock market has shown tremendous volatility this past week. Since Black Friday after Thanksgiving, the market has gone up 6 days followed by sharp declines for the last 3 days. One might expect that the market may find a short-term bottom either Tuesday or Wednesday based on time symmetry. And based on the internal indicators listed below, a bottom will also require 2 to 4 more days of decline before reaching oversold readings.
Key underlying short-term timing indicators show the following:
***********
THE BOTTOM LINE: The Fear/Greed Index is currently reading 11 or “Extreme Fear.” The sentiment is certainly negative as this indicator has remained in the negative territory for a couple of months now. The trading environment is very tricky and will punish anyone who is on the wrong side of the market. If you have the temperament to trade, you’ll find lots of opportunities for some fast money. But for most people, this is a market to avoid until it calms down and shows more signs of capitulation. The “blood” is not quite “on the street” but it’s getting there. Be careful out there!
STOCK MARKET STRATEGY FOR DECEMBER 1, 2018: The stock market has gone straight up since its bottom on Black Friday. That day was marked by a new closing low that was not confirmed by the majority of breadth and momentum indicators. This is a classic “Granville Buy Signal” named for the infamous stock market analyst of the period from 1977 to 1983. From this point forward, after the strongest one week rally in stock market history, one could expect that the market to continue going higher in a zig-zag pattern until the end of the year. If you missed this last opportunity, you’ll have to buy on any short-term oversold conditions.
Key underlying short-term timing indicators show the following:
***********
THE BOTTOM LINE: The Fear/Greed Index is currently reading 22 or “Extreme Fear.” It should be in the “neutral” zone shortly with the continued rally in the stock market. Use any short-term oversold readings as a place to add to long positions through the end of the year. It looks like a “Santa Claus Rally” is in the cards for this year.