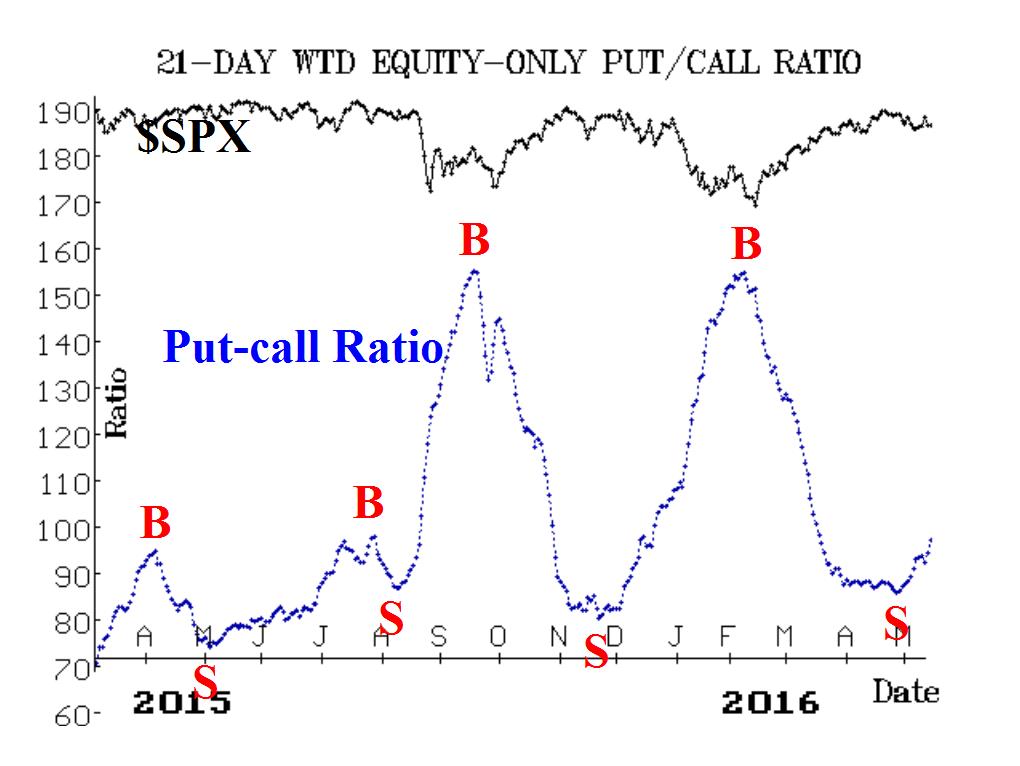
 The stock market appears to be at the very end of its rally since February 11, 2016. The only thing that prevents me from being downright bearish, is the possibility that the Brexit bottom may have already flushed out the weak hands and created an intermediate-term low. But most of all, this indicator makes an investor or trader aware of the risks to holding long positions in the general market at this time. Better odds for upside appreciation seems likely at another time down the road. (Source: www.optionstrategist.com)
Categories: Put/Call Ratio Timing Indicator Tags: 401k, annuities, insurance, investing, investing tips, investments, life insurance, money, pension plan, QQQ, retirement, SPY, stock action, stock market, stock trading, stock trading tips, stocks, tony robbins, trading, trading tips, wall street
 The tide has turned according to this venerable intermediate-term indicator. And while short-term bounces can occur whenever the market gets slightly oversold, this chart shows us that the really good buying opportunities occur when the red “B” is closer to the 150 level on the left axis. This level does not appear to be possible for at least another month of market activity. The general pessimism in the market is not yet at the level of fear that is needed in order to buy for the longer term. (Source: www.optionstrategist.com)
Categories: Put/Call Ratio Timing Indicator Tags: 401k, annuities, insurance, investing, investing tips, investments, life insurance, money, pension plan, QQQ, retirement, SPY, stock action, stock market, stock trading, stock trading tips, stocks, tony robbins, trading, trading tips, wall street
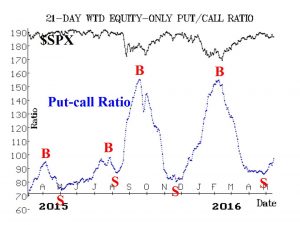 This intermediate-term indicator shows that the rally from February 11th is over. The next destination is a buy signal marked by the red “B” which should ideally arrive when the x-axis is above 150. In terms of time, that would project to the July time period if you were to measure the space between the two most recent buy signals. Based on this, it would be prudent to sit out the action in the stock market until more severe pain causes a better buying opportunity. With the goal of buying low and selling high, it is not a time to buy now. (Source: www.optionstrategist.com)
Categories: Put/Call Ratio Timing Indicator Tags: 401k, annuities, insurance, investing, investing tips, investments, life insurance, money, pension plan, QQQ, retirement, SPY, stock action, stock market, stock trading, stock trading tips, stocks, tony robbins, trading, trading tips, wall street
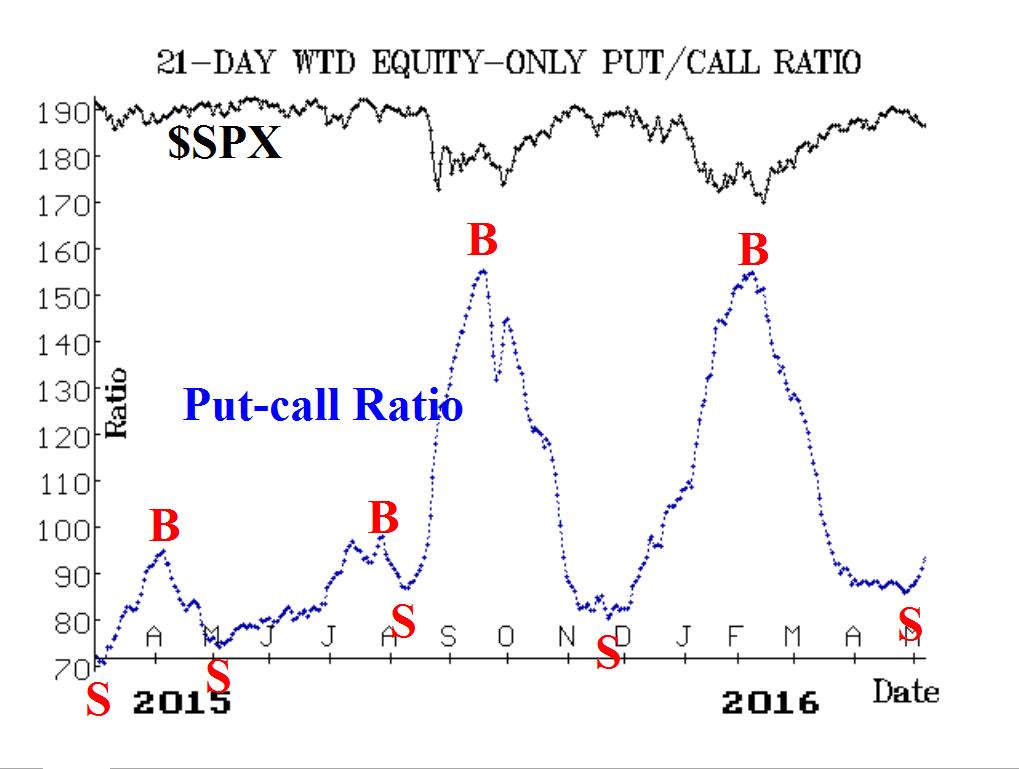
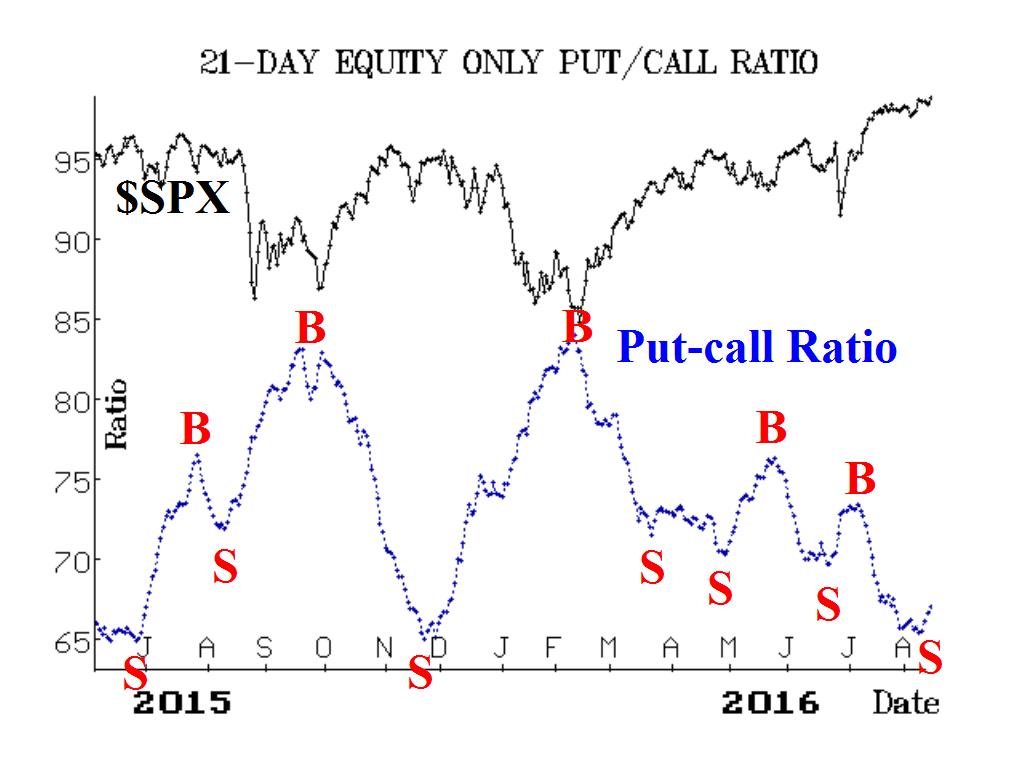
 This reliable intermediate-term indicator suggests that an important sell signal has just been triggered for the general market. While tops tend to be broader and trickier than bottoms, it still implies that this is not a good time to be long equities or to initiate new purchases. But with breadth indicators at oversold readings on Friday, we could have one small rally from here before resuming a further decline. The buy signal (red B on the chart) is projected to be around July-August based on an equal time interval. (Source: www.optionstrategist.com)
Categories: Put/Call Ratio Timing Indicator Tags: 401k, annuities, calls, futures, insurance, investing, investing tips, investments, life insurance, money, options, pension plan, puts, QQQ, retirement, SPY, stock action, stock market, stock trading, stock trading tips, stocks, tony robbins, trading, trading tips, wall street
 The stock market appears to be at the very end of its rally since February 11, 2016. The only thing that prevents me from being downright bearish, is the possibility that the Brexit bottom may have already flushed out the weak hands and created an intermediate-term low. But most of all, this indicator makes an investor or trader aware of the risks to holding long positions in the general market at this time. Better odds for upside appreciation seems likely at another time down the road. (Source: www.optionstrategist.com)