 STOCK MARKET STRATEGY FOR APRIL 23, 2017: The stock market remains in a neutral position with the ability to go in either direction. The last two weeks has presented the market with an opportunity to become “oversold” but rallied modestly instead to prevent investors and traders from getting to a low-risk entry point. Expect the market to set itself up for the next trading opportunity in the coming weeks, but right now it’s best to take a wait and see approach to this tricky news-driven market.
Key underlying short-term market indicators show the following:
***********
THE BOTTOM LINE: The Fear/Greed Index is currently reading “Fear” after being in the “Extreme Fear” range for only one trading day. I would expect a much deeper reading in the “Extreme Fear” range in order to safely say that the stock market is “oversold” or “under-loved” in terms of sentiment. The current geopolitical climate should serve to push sentiment strongly in one direction or the other. And most likely, it will create the desire emotion of “extreme fear” which allows presents disciplined traders with a low-risk buying opportunity. So right now it’s best to let the market set itself up for the next trading opportunity.
Categories: Stock Market Strategy Tags: insurance, investing, investments, money, retirement, stock market, stock market timing, stock trading, stocks, tony robbins, trading, wall street
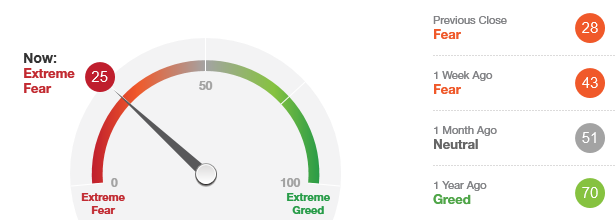 The “Fear/Greed Sentiment Index: What Emotion is Driving the Market Now?” reading has finally moved into the “Extreme Fear” range this past week. But it is just touching that area and I would expect a reading under 20 in order to feel like it is truly registering “Extreme Fear.”
But this indicator is now saying that it’s time to start thinking about accumulating pilot positions for the next rally. The challenge is that there hasn’t been much price erosion in the market since its March top. Hence, many positions are still well over their 200-day moving averages with plenty more room to correct.
I’d look at this indicator as simply a sign to start thinking about going long the general market and use other breadth indicators to fine-tune the timing. And many of the breadth indicator are starting to flash buy alerts as well. So a bottom is close at hand unless we rally quickly to lessen the downward pressure.
Categories: Fear & Greed Index Tags: insurance, investing, investments, money, retirement, stock market, stock market timing, stock trading, stocks, tony robbins, trading, wall street
STOCK MARKET STRATEGY FOR APRIL 8, 2017: The stock market remains in neutral territory despite the unstable news background. But the news will help create the cover story for the next top or bottom as it will polarize public sentiment. Right now it appears that the breadth oscillators are heading down towards an oversold bottom in the near term (3 to 5 days). If the readings become low enough, a rally worth trading to the upside may be in store for us. But until those low reading occur, it’s probably wisest to keep your powder dry for better odds in playing this tricky market.
Key underlying short-term market indicators show the following:
***********
THE BOTTOM LINE: The Fear/Greed Index is currently reading “Fear” after being in the “Neutral” area for a week. The set-up in the breadth oscillators suggests that a short-term bottom is nearby. If the Fear/Greed Sentiment Index can register an “Extreme Fear” reading in the meantime, we may have a sharp rally to ride into May. But until that sets up properly, it’s best to do nothing except get your ducks in a row.
Categories: Stock Market Strategy Tags: insurance, investing, investments, money, retirement, stock market, stock market timing, stock trading, stocks, tony robbins, trading, wall street