STOCK MARKET STRATEGY FOR MAY 28, 2016: The stock market recovered 3 weeks worth of correction in just 2 days! But now it is reaching overbought levels which puts a lid on further advances for the time being. But after a short, mild, or sideways correction, a move to new highs is very possible. Perhaps it has more to do with time than price. By that I mean, that the market needs a week to correct its move and it doesn’t matter how many points it goes down. What matters is that a buying opportunity is likely during the second week of June and it would be wise to prepare for it.
Key underlying short-term market indicators show the following:
***********
THE BOTTOM LINE: The stock market needs a breather. The upside is limited from here as the internal indicators are near or at overbought levels. But after some time spent going down or sideways, there might be a good entry point to ride this market to new highs. Be prepared for a buying opportunity during the second week of June.
Categories: Stock Market Strategy Tags: insurance, investing, investments, life insurance, money, pension plan, QQQ, retirement, SPY, stock action, stock market, stock trading, stock trading tips, stocks, tony robbins, trading, trading tips, wall street
STOCK MARKET STRATEGY FOR MAY 22, 2016: The stock market bounced off of trendline and moving average support levels intraday on Thursday. This was from semi-oversold levels and could be the marking of a bottom. If so, I’d be looking for a zig-zag down in the coming week to provide another entry point for a short-term trade. But otherwise, a major intermediate bottom would require more prolonged emotional pain in the minds of investors and that doesn’t appear to be the case now.
Key underlying short-term market indicators show the following:
***********
THE BOTTOM LINE: The stock market may provide an entry point this week for a short-term trade. But a more sustained bottom will require more pain in terms of lower prices. That won’t happen until June at the very earliest. With the internal indicators in neutral positions, the market can go in either directions with the same probability. Stay on the sidelines for now.
Categories: Stock Market Strategy Tags: insurance, investing, investments, life insurance, money, QQQ, retirement, SPY, stock action, stock market, stock trading, stock trading tips, stocks, tony robbins, trading, trading tips, wall street
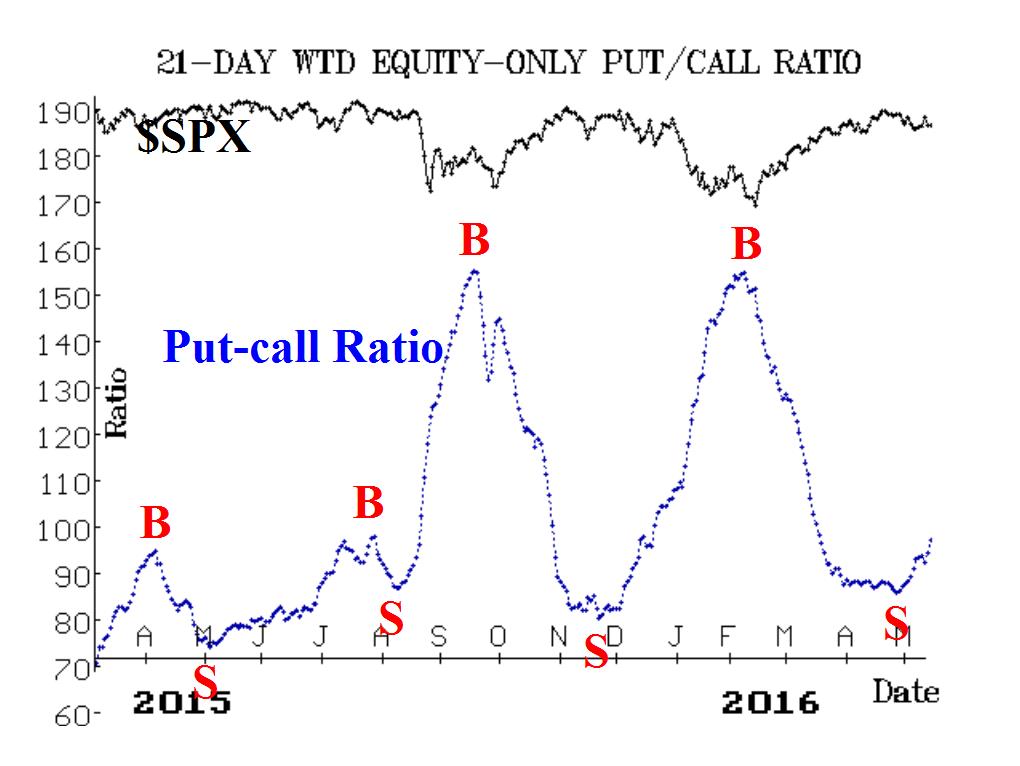
 The tide has turned according to this venerable intermediate-term indicator. And while short-term bounces can occur whenever the market gets slightly oversold, this chart shows us that the really good buying opportunities occur when the red “B” is closer to the 150 level on the left axis. This level does not appear to be possible for at least another month of market activity. The general pessimism in the market is not yet at the level of fear that is needed in order to buy for the longer term. (Source: www.optionstrategist.com)
Categories: Put/Call Ratio Timing Indicator Tags: 401k, annuities, insurance, investing, investing tips, investments, life insurance, money, pension plan, QQQ, retirement, SPY, stock action, stock market, stock trading, stock trading tips, stocks, tony robbins, trading, trading tips, wall street
STOCK MARKET STRATEGY FOR MAY 15, 2016: The stock market bounced from an oversold condition mid-week and then reversed to the downside by Friday. With the internal indicators reset to neutral positions, the market can experience moves in either direction. This sets up a volatile market and one that is likely to have some scary moments to the downside. While a retest of previous highs in still a possibility, I would stay out until a better bottom appears as a result of higher investor fear in the market.
Key underlying short-term market indicators show the following:
***********
THE BOTTOM LINE: The stock market could go in either direction. My guess is that the market needs more fear in order to sustain a rally worth betting on. So expect bad news and increased volatility in the near term in order to create the ideal buying situation.
Categories: Stock Market Strategy Tags: 401k, insurance, investing, investing tips, investments, life insurance, money, pension plan, QQQ, retirement, SPY, stock action, stock market, stock trading, stock trading tips, stocks, tony robbins, trading, trading tips, wall street
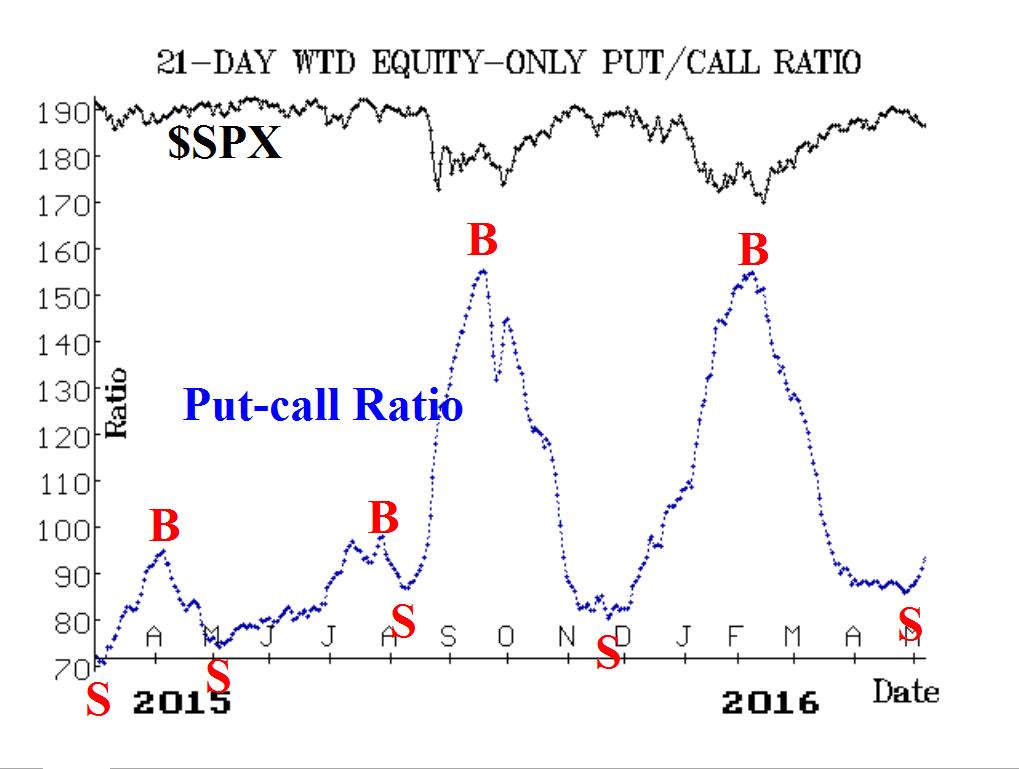
 This intermediate-term indicator shows that the rally from February 11th is over. The next destination is a buy signal marked by the red “B” which should ideally arrive when the x-axis is above 150. In terms of time, that would project to the July time period if you were to measure the space between the two most recent buy signals. Based on this, it would be prudent to sit out the action in the stock market until more severe pain causes a better buying opportunity. With the goal of buying low and selling high, it is not a time to buy now. (Source: www.optionstrategist.com)
Categories: Put/Call Ratio Timing Indicator Tags: 401k, annuities, insurance, investing, investing tips, investments, life insurance, money, pension plan, QQQ, retirement, SPY, stock action, stock market, stock trading, stock trading tips, stocks, tony robbins, trading, trading tips, wall street
STOCK MARKET STRATEGY FOR MAY 8, 2016: The stock market reached oversold breadth conditions on Thursday’s close. The early down move on Friday presented an opportunity to enter the market for a possible ride back to challenge the previous highs. The market’s character for the past several years is to form V-shaped bottoms on corrections so don’t be surprised if it goes straight up from here. Traders – look for any weakness on Monday as one more chance to buy this market for a short-term rally.
Key underlying short-term market indicators show the following:
***********
THE BOTTOM LINE: The stock market may go up from here based on oversold breadth indicators. This will probably be the last rally in this market and be the proverbial “Sell in May” high for the intermediate term. The best place to be on final rallies is usually the Dow Jones Industrial Average (DIA). And as legendary market analyst, Joseph Granville, used to point out, “The last rally is usually lead by the oils.”
Categories: Stock Market Strategy Tags: 401k, annuities, insurance, investing, investing tips, investments, life insurance, money, pension plan, QQQ, retirement, SPY, stock action, stock market, stock trading, stock trading tips, stocks, tony robbins, trading, trading tips, wall street
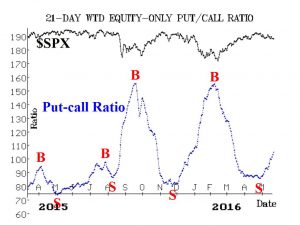
 This reliable intermediate-term indicator suggests that an important sell signal has just been triggered for the general market. While tops tend to be broader and trickier than bottoms, it still implies that this is not a good time to be long equities or to initiate new purchases. But with breadth indicators at oversold readings on Friday, we could have one small rally from here before resuming a further decline. The buy signal (red B on the chart) is projected to be around July-August based on an equal time interval. (Source: www.optionstrategist.com)
Categories: Put/Call Ratio Timing Indicator Tags: 401k, annuities, calls, futures, insurance, investing, investing tips, investments, life insurance, money, options, pension plan, puts, QQQ, retirement, SPY, stock action, stock market, stock trading, stock trading tips, stocks, tony robbins, trading, trading tips, wall street