WALL STREET CRAPS STOCK MARKET STRATEGY OCTOBER 28, 2018
 STOCK MARKET STRATEGY FOR OCTOBER 28, 2018: The stock market dropped hard last week taking out support levels in all indices. With several breadth indicators in oversold territory, one would expect another bounce to occur soon. But in terms to sustaining a strong upside rally, I expect more downside with lower lows. If we should get oversold readings in the McClellan Oscillators, I’d want to play a relief rally of several hundred points. That could come sometime next week with a test of the early 2018 lows around 2530 in the S&P 500.
Key underlying short-term timing indicators show the following:
- NYSE McClellan Oscillator – Ultimate Indicator Reading – 43 (neutral)
- Nasdaq McClellan Oscillator – Ultimate Indicator Reading – 42 (neutral)
- Volatility Indicator – Ultimate Indicator Reading – 23 (Oversold)
- S&P 500 % Above 50-Day Moving Average – 19 (Oversold)
- Nasdaq 100 % Above 50-Day Moving Average – 20 (Oversold)
***********
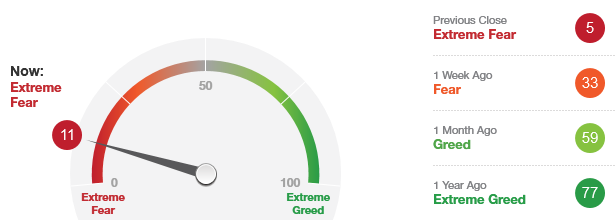
THE BOTTOM LINE: The Fear/Greed Index is currently reading 7 or “Extreme Fear.” It has been in this territory for a few weeks now and is an indicator of a major correction if not the start of a Bear Market. But in “Wall Street Craps” terms, the tables are cold and lots of money can be lost betting heavier on a cold table. So aside from a quick light trade with tight stops, you should keep most of your money on the sidelines.