The stock market appears to have completed its Bear Market rally from the October lows. Don’t be surprised if those October lows are tested in the coming weeks with either a low-volumn Dow Theory non-confirmation or a climatic high-volume crash to occur. In most cases, this would be a good time to step aside and let the market set itself up for a better opportunity in late December or in the January/February time period. This is a tricky time in the market where a Bear or Bull can easily lose money and/or sleep!
Key underlying short-term timing indicators show the following:
NYSE McClellan Summation Index: This index’s oscillator has a current reading of 76 and trending down. This indicator is starting to cluster now after a big run-up since October. The cycle of this indicator would suggest that it is now time for the market to head down for a number to weeks before clustering again to form a stable bottom.
Fear/Greed Index: This popular indicator is in the “Neutral” territory with a reading of 54 and trending down. Having been in the “Greed” range for many weeks, it looks like this indicator is heading back towards the “Extreme Fear” area that is required for a good bottom. The trick here is to be patient enough to see a reading in the “Extreme Fear” range, but on the lookout for the deep bottom move to the under 5 reading of major bottoms. This is always a distinct possibility.
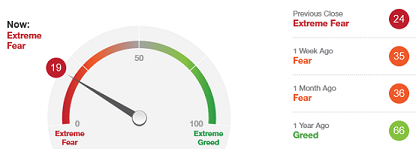
The Fear & Greed Index moved strongly into “Extreme Fear” territory today with a reading of 19. Solid intermediate-term bottoms have occurred when this indicator gets as low as 2 or 3. There is a chance that this indicator is setting up for such an occurrence during next week. That provides enough time for more bad news to hit bullish investors into dumping their holdings at the bottom in a brief period of maximum fear.
The stock market traded lower for most of the week that coincided with the turmoil in Afghanistan. With the rally on Friday, the Dow Jone Industrial Average is about 500 points below its August 16th high. I would expect a rally to new highs to be unconfirmed by the majority of other indicators. That would set up a Dow Theory Sell Signal as well as a Granville Sell Signal worth shorting or selling existing long positions. Such a scenario could take place in the next 3-7 trading sessions so be on your toes for this developing opportunity.
Key underlying short-term timing indicators show the following:
Fear/Greed Index: This popular indicator is in the “Extreme Fear” territory with a reading of 25 after being in the “Extreme Fear” zone with a reading of 22 on Thursday. The best buy signals on major corrections have occurred when the reading gets below 10, however.
Monday August 23rd Note: The Granville Sell Signal usually occurs when the new unconfirmed high in the Dow Jones Industrial Average coincides with an obvious public good news cover story. Could the Pfizer COVID vaccine FDA approval be that cover story?
The stock market spiked down on Monday and then rallied strongly the remaining 4 days of the week. I was looking for a trade set-up on Tuesday morning, the market did not present an opportunity to “fade” the trade . This has happened often in the past and it is often wisest to buy during the last half hour of trading instead of letting the futures market change course and ruin your trading plans. I missed a good trading opportunity by trying to be too perfect in a tricky market. In this case, it’s more important to determine a gradual betting strategy than trying to time a “hot and cold” market too closely.
Key underlying short-term timing indicators show the following:
Fear/Greed Index: This popular indicator is in the “Fear” territory with a reading of 32 after being in the “Extreme Fear” zone with a reading of 17 on Monday. So this indicator did flash a clear buy signal of Monday which I saw but didn’t act on.
Note: Friday July 23rd’s, new closing high in the Dow Jone Industrial Average was not confirmed by the Dow Jones Transportation Average. This sets up a classic Dow Theory Sell Signal. Mark this date as a possible intermediate term top.
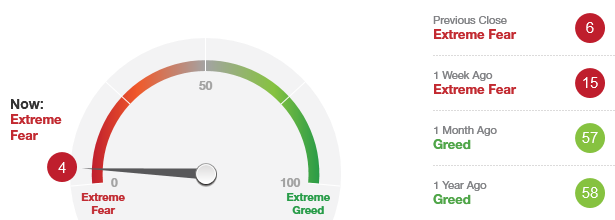
The “Fear/Greed Sentiment Index: What Emotion is Driving the Market Now?” has a current reading of “4” which indicates that we are in the area of an “Extreme Fear” buy signal. This is only one criteria for a trading bottom but an important one. The December 24, 2018 bottom had a reading of “2” so we are in that rare general area. Any reading below this is probably worth a trade to the long side. This indicator does not stay in this area for very long.
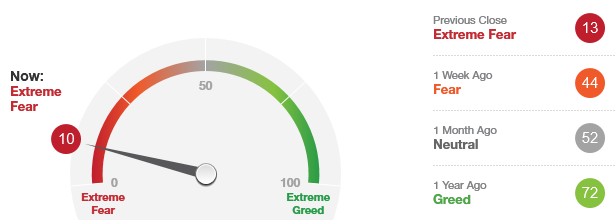
The “Fear/Greed Sentiment Index: What Emotion is Driving the Market Now?” has a current reading of “10” which indicates that we are in the area of an “Extreme Fear” buy signal. This is only one criteria for a trading bottom and it could easily go down further. An “Extreme Fear” reading of “2” occurred at the December 2018 bottom. So be careful here. There is still room for more downside and the stretching of this indicator.
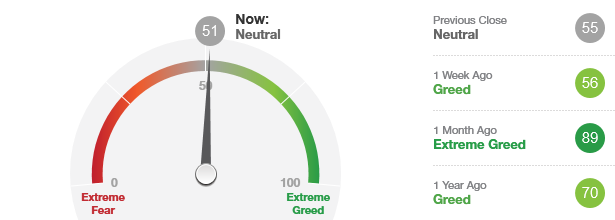
The “Fear/Greed Sentiment Index: What Emotion is Driving the Market Now?” has a current reading of “51” which indicates that we are quite possibly traversing the range towards an “Extreme Fear” buy signal. With the current strength in the markets, I would only expect this indicator to briefly touch the under “30” reading. It should then explode higher.
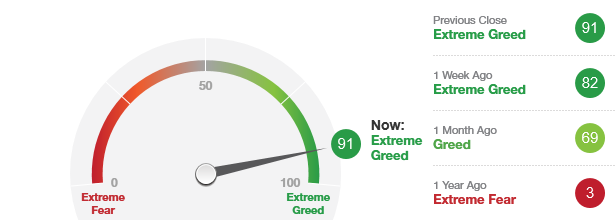
The “Fear/Greed Sentiment Index: What Emotion is Driving the Market Now?” has a current reading of “91” which indicates that we are in the area of a top. Keep in mind that more often than not, the final top or ideal sell point occurs when this indicator is above a reading of “90.” While this does not mean it is a time to short the market, it does mean that it is not the time to buy.
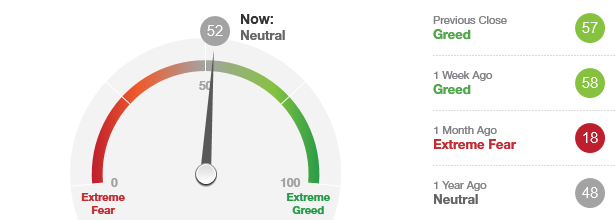
The “Fear/Greed Sentiment Index: What Emotion is Driving the Market Now?” has a current reading of “52” which is not indicating a nearby top or bottom. Keep in mind that more often than not, the final bottom or ideal buy point occurs when this indicator is below a reading of “10.”
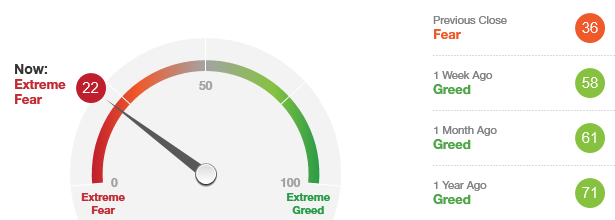
The “Fear/Greed Sentiment Index: What Emotion is Driving the Market Now?” has a current reading of “22” which is the first step to getting a tradable bottom. But keep in mind that more often than not, the final bottom or ideal buy point occurs when this indicator is below a reading of “10.”
Neither the information nor the opinions expressed should be construed as a solicitation to buy or sell any Exchange-Traded Fund, stock, option, mutual fund, currency or commodity. Past performance is not necessarily indicative of future results. You may lose money trading and investing. Trade at your own discretion: we don't share in your profits, so we don't share in your losses. We may have a financial interest in one or more of the securities discussed in this blog. Investors should obtain the advice of a qualified investment advisor before entering into any transactions. This blog serves as an educational and entertainment website only. We are not Registered Investment Advisors and do not in any way claim to be either.