 STOCK MARKET STRATEGY FOR DECEMBER 9, 2018: The stock market has shown tremendous volatility this past week. Since Black Friday after Thanksgiving, the market has gone up 6 days followed by sharp declines for the last 3 days. One might expect that the market may find a short-term bottom either Tuesday or Wednesday based on time symmetry. And based on the internal indicators listed below, a bottom will also require 2 to 4 more days of decline before reaching oversold readings.
Key underlying short-term timing indicators show the following:
***********
THE BOTTOM LINE: The Fear/Greed Index is currently reading 11 or “Extreme Fear.” The sentiment is certainly negative as this indicator has remained in the negative territory for a couple of months now. The trading environment is very tricky and will punish anyone who is on the wrong side of the market. If you have the temperament to trade, you’ll find lots of opportunities for some fast money. But for most people, this is a market to avoid until it calms down and shows more signs of capitulation. The “blood” is not quite “on the street” but it’s getting there. Be careful out there!
STOCK MARKET STRATEGY FOR DECEMBER 1, 2018: The stock market has gone straight up since its bottom on Black Friday. That day was marked by a new closing low that was not confirmed by the majority of breadth and momentum indicators. This is a classic “Granville Buy Signal” named for the infamous stock market analyst of the period from 1977 to 1983. From this point forward, after the strongest one week rally in stock market history, one could expect that the market to continue going higher in a zig-zag pattern until the end of the year. If you missed this last opportunity, you’ll have to buy on any short-term oversold conditions.
Key underlying short-term timing indicators show the following:
***********
THE BOTTOM LINE: The Fear/Greed Index is currently reading 22 or “Extreme Fear.” It should be in the “neutral” zone shortly with the continued rally in the stock market. Use any short-term oversold readings as a place to add to long positions through the end of the year. It looks like a “Santa Claus Rally” is in the cards for this year.
STOCK MARKET STRATEGY FOR OCTOBER 21, 2018: The stock market has either completed its bounce or is in the process of retesting the previous lows. I have a hunch that whichever direction the market goes on Monday, the rest of the week will do the opposite. So if we get a rally on Monday, I’d be selling into that strength, but conversely I’d be buying on a retest of the lows. Of course this is a gamble, but something that I see as an opportunity for gain.
Key underlying short-term timing indicators show the following:
***********
THE BOTTOM LINE: The Fear/Greed Index is currently reading 14 or “Extreme Fear.” It has been in the this area for over a week and usually doesn’t stay here for more than two weeks. So the market is either going to rally here or is in the middle point of a decline into a lower-risk buying zone before the election.
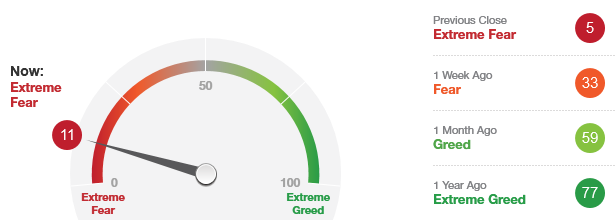 The “Fear/Greed Sentiment Index: What Emotion is Driving the Market Now?” has a current reading of 11 after reaching an even more extreme reading of 5 on Friday. This suggests that the market is within the buying opportunity area.
This indicator has gone down enough but only may need to spend more time in this area before rallying upwards in the coming weeks.
With the internal indicators in “oversold” readings, this suggests that a tradable bottom could occur in this time period – which is within the next two weeks. However, there is always the possibility of one more crash down of obvious “bad news” in order to shake out the weak hands.
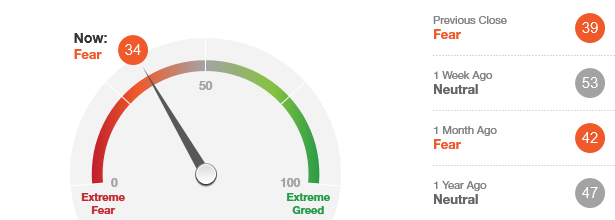 The “Fear/Greed Sentiment Index: What Emotion is Driving the Market Now?” has a current reading of 34 which is in the “Fear” zone. This suggests that the market is within range of a buying opportunity on further weakness.
This indicator has been in the “neutral” area for some time as well as “Fear” and “Greed,” but it has avoided both “Extreme Fear” and “Extreme Greed” readings in past month.
With the internal indicators approaching “oversold” readings, this suggests that a tradable bottom could occur in the coming week to 10 days. While it is uncertain to how powerful a rally might be from here, it probably is worth taking some positions on weakness particularly if it is accompanied by “obvious bad news.”
 MARKET OBSERVATIONS FOR APRIL 29, 2013: The stock market may be headed to its final closing high in the Dow Jones Industrial Average. It is approaching overbought levels while remaining 150 points below its previous high. From a technical standpoint, the final closing high in the Dow Jone Industrial Average while not be confirmed by the majority of other key indicators or averages. Be on the lookout for this final solo march up by the Dow. On the other hand, if the Dow does have support from the majority of other averages, then this rally can continue higher into June.
Key market indicators show the following:
For now, my advice is to remain on the sidelines and let the market set itself up for its next big move. A major top could be ahead of us shortly. But the neutral sentiment readings cause me to think that the market still needs more time on the upside. Stay flexible and read the market as it moves in either direction for clues.
**********
MARKET OBSERVATIONS FOR MARCH 17, 2013: The stock market hit consecutive new highs for 10 trading sessions. That remarkable string was broken on Friday with the market’s modest decline. While the general market is certainly overbought by many measures, it is not as over-loved as you might expect. Since investor sentiment is still largely neutral, the market may correct in the short-term and then present investors with another chance to buy for the next leg up. That appears to be a less risky approach to making money than trying to short this relentlessly bullish market.
Key market indicators show the following:
Many key breadth indicators are showing neutral readings even after this persistent advance. If the market continues to march upwards in the coming week, it may present an opportunity to buy the Long-Term Treasury Bond ETF (TLT). This is one of the best ways to participate with less risk in a downward market as opposed to going short or buying inverse Exchange-Traded Funds.
If the market heads down next week, it may set up a short term buying opportunity for a continuation of this advancing market. So be ready to move in either direction as the market reveals its next opportunity for traders and investors.
**********
MARKET OBSERVATIONS FOR MARCH 9, 2013: The stock market hit consecutive new highs during the last 6 trading sessions. This is a classic example of letting a powerful move run its course and resisting the urge to short. The upside momentum has probably peaked at this time, but after a short correction, I’d expect at least one more overshoot rally to a new closing Dow high. In order for that scenario to pan out, we first need a sharp and broad correction lasting a week to 10 days. Then one final narrow advance up to a new high which is not confirmed by breadth and other broad-based averages.
Key market indicators show the following:
With many key breadth indicators at or near sell signal levels, I would be looking for a correction to begin on Monday. This will be the first leg down with most likely a retest of Friday’s highs in one to two weeks. Since the “Wall Street Craps Method” discourages both leverage and shorting the market, the best thing to do is remain on the sidelines and let the market correct. Then look for either a short-term upside opportunity in the general market or a trade in the Long Treasury Bond ETF (TLT).
Remember that the sentiment indicators show that market participants are still neutral. This is not a sign of a major top. So a correction here would give nimble traders and investors a chance to ride this market up when the rally resumes.
**********
MARKET OBSERVATIONS FOR FEBRUARY 25, 2013: The stock market hit a new high last Tuesday before embarking on a sharp decline. Friday’s advance recovered most of the previous two-day decline. The market is in the unique position to either test last Tuesday high or test last Thursday low. Don’t be surprised if the market follows a common pattern of heading down towards the end of the month (and rallying in the beginning).
Key market indicators show the following:
With many key breadth indicators near buy signal levels, I would welcome a return to last Thursday’s low with a chance to go long towards an intermediate top in March.
**********