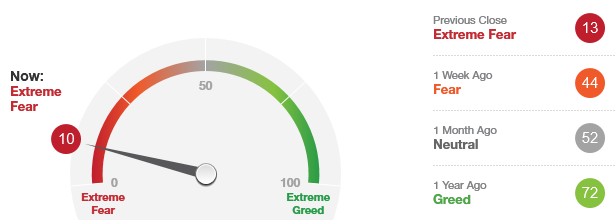
 The “Fear/Greed Sentiment Index: What Emotion is Driving the Market Now?” has a current reading of “10” which indicates that we are in the area of an “Extreme Fear” buy signal. This is only one criteria for a trading bottom and it could easily go down further. An “Extreme Fear” reading of “2” occurred at the December 2018 bottom. So be careful here. There is still room for more downside and the stretching of this indicator.
 STOCK MARKET STRATEGY FOR FEBRUARY 23, 2020: The stock market experienced a broad decline over the past week. In the process, many internal indicators are now trending down towards a possible low and buying opportunity in the near term. The question will be whether this bounce is worth buying or not. At this time, it is hard to determine if the current downtrend will gather momentum or not.
Key underlying short-term timing indicators show the following:
***********
THE BOTTOM LINE: The stock market is trending down into a likely bounce towards the end of next week. For the quick and nimble, it might be worth playing this bounce for a quick gain. But for others, it might be wise to let the market determine the true strength of this decline and whether it’s simply better to sit on the sidelines for awhile.
Categories: Stock Market Strategy, Stock Market Timing Tags: invest, investing, investing tips, investments, retirement, SPY, stock action, stock market, stock market timing, stock trading, stock trading tips
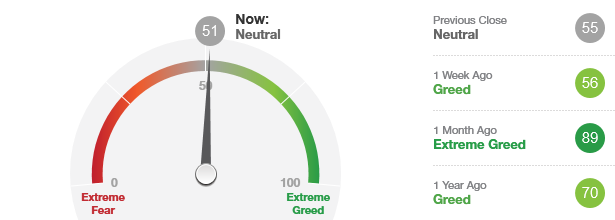 The “Fear/Greed Sentiment Index: What Emotion is Driving the Market Now?” has a current reading of “51” which indicates that we are quite possibly traversing the range towards an “Extreme Fear” buy signal. With the current strength in the markets, I would only expect this indicator to briefly touch the under “30” reading. It should then explode higher.
Categories: Fear & Greed Index, Stock Market Strategy, Stock Market Timing Tags: invest, investing, investing tips, investments, retirement, SPY, stock action, stock market, stock market timing, stock trading
STOCK MARKET STRATEGY FOR FEBRUARY 8, 2020: The major indices in the stock market (Dow, S&P, Nasdaq) all hit historic highs on January 17, 2020. A sharp decline followed with a bottom on January 31st. Then a rally ensued with new highs claimed on Thursday February 6. The time period between the two highs 14 trading sessions. This pattern could qualify as a classic “Joe Granville Top” with February 6th being the external top of the Bull Market and the “Obvious Cover Story” being the end of the Impeachment Trial and a seemingly clear path to a Trump Election victory.
Key underlying short-term timing indicators show the following:
***********
THE BOTTOM LINE: The stock market may have hit its high for the Bull Market on Thursday February 6th with the “Obvious Good News Cover Story,” euphoria in the markets, and narrow new highs & crazy action in glamour tech stocks like Tesla. This would be a good time to “take the money and run” or lighten up on overextended, overvalued positions. Note: This most recent new all-time high was quietly achieved without any mention of it being a final top of the market. The bears appear to have given up predicting the final top. We shall see…..
Categories: Stock Market Strategy, Stock Market Timing Tags: invest, investing, investing tips, investments, retirement, SPY, stock action, stock market, stock market timing, stock trading, stock trading tips