 STOCK MARKET STRATEGY FOR MARCH 12, 2019: The stock market made a nice short-term bottom last Friday after a sustained move down. Although the prices didn’t go down much, the internal indicators were clearly oversold. My only hesitation was that the “Volatility Indicator” was only mid-range and I was concerned that the selling would continue for one to two more day. But I was wrong.
Key underlying short-term timing indicators show the following:
***********
THE BOTTOM LINE: The market may have reached a bottom that could propel the general market to new highs. It is now primed to “climb the wall of worry” to new highs without much resistance. For those like me who missed it, there may not be a good place to reenter the market here.
Categories: Stock Market Strategy, Stock Market Timing Tags: investing, investing tips, investments, retirement, stock action, stock market, stock market timing, stock trading, stock trading tips, stocks, trading advice, trading tips, wall street
STOCK MARKET STRATEGY FOR FEBRUARY 18, 2019: The stock market rallied from its short-term oversold readings last week to the surprise of many. To simplify things, I’ve decided to reduce the number of important indicators that I follow for swing trading in order to make clearer decisions. My experience is that too many indicators lead to more confusion and less action on a daily basis. And I’ve chosen the three indicators that are both less followed, more accurate, and more frequent in producing high-probability trading signals.
Key underlying short-term timing indicators show the following:
***********
THE BOTTOM LINE: The market continues to rally in an almost “straight up” fashion. Aside from last week’s mild “oversold” reading, there hasn’t been much, if any, resistance to the advance. And in doing so, it has frustrated many chartists and technical market players. The smart thing here is to wait for the next “oversold” reading from the three key indicators above and trade lightly with the objective to “taking the money and run.” The time for taking longer term investment positions was back in December.
Categories: Stock Market Strategy, Stock Market Timing Tags: investing, investing tips, investments, retirement, stock action, stock market, stock market timing, stock trading, stock trading tips, stocks, trading advice, trading tips, wall street
STOCK MARKET STRATEGY FOR FEBRUARY 10, 2019: The stock market showed some downside action with a turnaround near the close of Friday. Two of the internal oscillators are in “oversold” territory and may suggest that the downside pressure should subside near-term. But the other internal indicators (new choices to reflect other perspectives of the market) suggest that this is all short-term action that needs more time to set up properly for a stronger move in either direction.
Key underlying short-term timing indicators show the following:
***********
THE BOTTOM LINE: The market may have hit a very short-term bottom on Friday but any major moves will require more time to set up properly. This may be a good time to step aside and let time create a better opportunity to trade.
Categories: Stock Market Strategy, Stock Market Timing Tags: investing, investing tips, investments, retirement, stock action, stock market, stock market timing, stock trading, stock trading tips, stocks, trading advice, trading tips, wall street
STOCK MARKET STRATEGY FOR FEBRUARY 4, 2019: The stock market has continued its strong, broad-based rally from the Christmas lows by going practically straight up. But now is the time for a correction of this rally (most likely starting after the State of the Union address Tuesday) and based on the momentum, I’d expect it to be more of a sideways, stalling decline than a steep drop which serves the purpose of chewing up time. But a good buying opportunity will likely arise from the next oversold reading.
Key underlying short-term timing indicators show the following:
***********
THE BOTTOM LINE: The market may be setting itself up for a decline starting after Trump gives his State of the Union speech. This correction may not amount to a lot of points to the downside, but I’d be a buyer on the next oversold bottom. I think that the December lows were an important pivot point for this market and a continuation of the Bull Market.
Categories: Stock Market Strategy, Stock Market Timing Tags: Categories: Stock Market Strategy, investing tips, investments, retirement, stock action, stock market, stock market timing, stock trading, stock trading tips, stocks, Tags: investing, trading advice, trading tips, wall street
STOCK MARKET STRATEGY FOR JANUARY 27, 2019: The stock market experienced a choppy week ending up about where it started. In the process, it has worked out some of its overbought condition. The internal indicators are largely neutral which suggests that the market can go in either direction with the same probability – either up towards heavy resistance or down for a 50% retracement.
Key underlying short-term timing indicators show the following:
***********
THE BOTTOM LINE: It’s anyone’s guess whether the market corrects from here or rallies and then corrects. Perhaps there will be a tradable low in mid-February to take new positions on the long side. But momentum still appears strong to the upside and it’s a tough bet trying to play the downside. The December low’s extreme technical readings may have put in a solid bottom for many months.
Categories: Stock Market Strategy, Stock Market Timing Tags: investing, investing tips, investments, retirement, stock action, stock market, stock market timing, stock trading, stock trading tips, stocks, trading advice, trading tips, wall street
STOCK MARKET STRATEGY FOR SEPTEMBER 30, 2018: The stock market is churning at a high consolidation area which neither good or bad. While it may seem like the market is overdue for a correction after this long rally, it still shows resiliency in the face of a mixed bag of political and economic news. With the three timing indicators set almost identically around the neutral reading of “50,” I’d expect the market to either correct into a short-term bottom or rally into resistance and a short-term top. But most of all, there is nothing to do right now.
Key underlying short-term timing indicators show the following:
***********
THE BOTTOM LINE: The Fear/Greed Index is currently reading 47 or “Neutral.” This makes the market within striking range of a quick move to “Extreme Fear” under 25 and a chance to a short-term tradable rally to participate in.
STOCK MARKET STRATEGY FOR MAY 19, 2018: The internal indicators of the stock market have been trending down the last few days, chewing up time, and possibly setting itself up for another trading bottom as early as late next week. Another plausible scenario is for next week to produce a bounce with a more stable bottom about two weeks out. In any event, there is nothing to do but wait for the next set-up and that can only happen with a bout of bad news.
Key underlying short-term timing indicators show the following:
***********
THE BOTTOM LINE: The Fear/Greed Index is currently reading 52 or “Neutral.” This doesn’t really tell you anything except that it has probably seen the worst in terms of extreme negative sentiment. One more quick trip to the “Extreme Fear” area will probably be all that it takes for another tradable intermediate term bottom.
Categories: Stock Market Strategy Tags: insurance, investing, investments, money, retirement, stock market, stock market timing, stock trading, stocks, tony robbins, trading, wall street
STOCK MARKET STRATEGY FOR APRIL 28, 2018: The stock market may be setting itself up for an intermediate-term bottom next week. The internal breadth indicators below are all close to oversold readings and additional weakness is sure to trigger buy signals. If a decline next week starts to materialize, then look at it as an opportunity to go long and ignore the “bad news” that has to happen in order to create the public selling. The trick will be if this happens mostly on Friday when it will take more guts to make trading commitments over an uncertain weekend.
Key underlying short-term timing indicators show the following:
***********
THE BOTTOM LINE: The Fear/Greed Index is currently reading 40 or “Fear.” This reading is after it has been in the “Extreme Fear” range for many weeks. I would expect a brief one or two day return to the “Extreme Fear” zone to coincide with a new intermediate buy signal on any weakness next week. If so, this “correction” will have scared enough weak hands out of the long game with only strong hands left to ride the next rally up. Of course, if we rally straight up from here then this scenario goes out the window and the deck will be “shuffled” once again.
Categories: Stock Market Strategy Tags: insurance, investing, investments, money, retirement, stock market, stock market timing, stock trading, stocks, tony robbins, trading, wall street
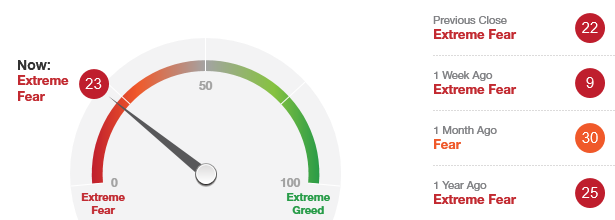 The “Fear/Greed Sentiment Index: What Emotion is Driving the Market Now?” has a current reading of 23 which is in the “Extreme Fear” zone. This suggests that the market is in a buying range and not a selling range. Tactically, this means that you should either buy or hold depending on your situation.
This indicator has remained in the “Extreme Fear” area for an abnormally long time. I would guess that it will leave this “oversold” area shortly and not return for some time. (After perhaps, one more spike down)
I would look to buy on any 2 to 3 day weakness that is accompanied by “obvious bad news” as the cover story for a good bottom in the market. I think that the next retest of the recent bottoms will be successful and that a sharp rally should follow. The only trick will be if the weakness occurs on a Friday where traders will have to sweat out the weekend of potentially more bad news.
Categories: Fear & Greed Index Tags: insurance, investing, investments, money, retirement, stock market, stock market timing, stock trading, stocks, tony robbins, trading, wall street
STOCK MARKET STRATEGY FOR MARCH 25, 2018: The stock market is setting itself up for a climatic bottom over the short-term. Breadth indicators are in “oversold” territory with the chance of become even more oversold if the market should sell-off on Monday-Tuesday. While a market panic is difficult to buy into, it may still be the proper strategy for buying low and selling high. But the proper to tactic would be to buy in smaller increments spread over 3-5 days during periods of weakness. This takes discipline that few amateurs possess.
Key underlying short-term timing indicators show the following:
***********
THE BOTTOM LINE: The Fear/Greed Index is currently reading 7 or “Extreme Fear.” With any weakness on Monday, this indicator will have the lowest reading in several years indicating a potential intermediate term bottom. To spread the risk, a wise trader should buy a combination of diversified broad-based ETFs and strong Blue-Chip dividend-paying stocks (example: Exxon, Microsoft, Apple, Wells Fargo). The first step would be to buy on extreme weakness in small pilot positions and add gradually. If a market panic should occur, it may take a few days for the market to stabilize or bounce. And then there is the possibility of a final wave down which a trader must be anticipate when conditions become so extreme as they are now.
Categories: Uncategorized Tags: insurance, investing, investments, money, retirement, stock market, stock market timing, stock trading, stocks, tony robbins, trading, wall street