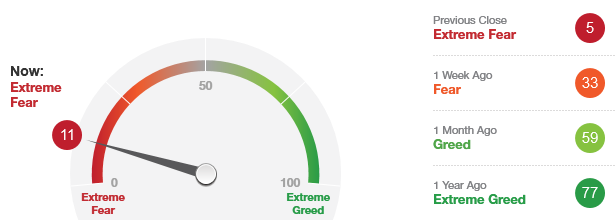
 The “Fear/Greed Sentiment Index: What Emotion is Driving the Market Now?” has a current reading of 11 after reaching an even more extreme reading of 5 on Friday. This suggests that the market is within the buying opportunity area.
This indicator has gone down enough but only may need to spend more time in this area before rallying upwards in the coming weeks.
With the internal indicators in “oversold” readings, this suggests that a tradable bottom could occur in this time period – which is within the next two weeks. However, there is always the possibility of one more crash down of obvious “bad news” in order to shake out the weak hands.
 STOCK MARKET STRATEGY FOR SEPTEMBER 30, 2018: The stock market is churning at a high consolidation area which neither good or bad. While it may seem like the market is overdue for a correction after this long rally, it still shows resiliency in the face of a mixed bag of political and economic news. With the three timing indicators set almost identically around the neutral reading of “50,” I’d expect the market to either correct into a short-term bottom or rally into resistance and a short-term top. But most of all, there is nothing to do right now.
Key underlying short-term timing indicators show the following:
***********
THE BOTTOM LINE: The Fear/Greed Index is currently reading 47 or “Neutral.” This makes the market within striking range of a quick move to “Extreme Fear” under 25 and a chance to a short-term tradable rally to participate in.
STOCK MARKET OBSERVATIONS FOR January 26, 2014: The stock market corrected sharply during this past week. While I did expect a little more strength earlier in the week, the overriding message was to stay out of long positions. This proved to be wise advice as almost all sectors experienced large percentage losses during the week. From here, the majority of internal indicators are about a day away from becoming oversold enough to produce a technical bounce. But I’d still expect that the final lows for this move aren’t going to happen until at least February.
Key underlying market indicators show the following
Another way to look at the general market is to see if there are matching oversold “Full Stochastics” readings on the major ETF broad-based averages. You will notice that all major intermediate bottoms start after oversold reading. The current readings require more time before reaching oversold levels. Note: The QQQ does not always reach oversold readings at bottoms due to its high relative strength:
- DIA – Full Stochastic – 37 (neutral) on lagging red line
- SPY – Full Stochastic – 61 (neutral) on lagging red line
- QQQ – Full Stochastic – 83 (neutral) on lagging red line
- IWM – Full Stochastic – 79 (neutral) on lagging red line
***********
My advice for traders and investors is to remain of the sidelines and let the market set itself up for a possible bottom in the intermediate term. The majority of internal indicators have moved into buy readings but need more time in the misery zone. Expect a short-term bounce early next week and then a retest 5 to 10 days after those previous lows. The time to take a chance on the long side is when weakness occurs amid obvious bad news on the retest of previous lows. That should come in February most likely.
***********
Note: Stock that have moved into their buy range according to the Money Flow Indicator include the following: General Electric and Berkshire-Hathaway.