 STOCK MARKET STRATEGY FOR NOVEMBER 18, 2018: The stock market appears to be in the process of retesting its October bottom. For now, it’s filled the upside gaps on its most recent move down. That means that a rally could possibly start from this area right now. Or it could begin down again, reach oversold conditions, and successfully test the October bottom. That kind of process would probably take place on the week following Thanksgiving.
Key underlying short-term timing indicators show the following:
***********
THE BOTTOM LINE: The Fear/Greed Index is currently reading 10 or “Extreme Fear.” It has been in this range for nearly a month and has shifted the sentiment to the negative. That means that a rally starting from this area could last several weeks or months. But the current short-term climate makes me think that catching the absolute bottom will be tricky as always. And a smart, well thought out betting strategy will be important in order to take positions without risk missing the opportunity. This requires that a trader pays close attention over the next two weeks.
STOCK MARKET STRATEGY FOR NOVEMBER 10, 2018: The stock market made a huge upside move in response to the election results on Wednesday. The question is whether that move signified a breakout to a new highs or a last grasp top for the latest bounce. Since this is anyone’s guess, the next entry point would likely be an oversold condition in the majority of breadth indicators. But a strong move down from here and a resumption of October’s down move would certainly change the character of the market again. This is a time for caution, as well as a time for opportunity for those willing to accept the risks and stomach the volatility.
Key underlying short-term timing indicators show the following:
***********
THE BOTTOM LINE: The Fear/Greed Index is currently reading 18 or “Extreme Fear.” While this is still in the “Extreme Fear” category, it is far off of the lows from the previous two weeks. This might suggest that the market is simply retracing its strong move up with a chance of forming another pivot bottom in about 5-10 trading days. So be alert and ready to act on a brief buying opportunity ahead.
STOCK MARKET STRATEGY FOR NOVEMBER 3, 2018: The stock market had a key reversal on Monday that carried over all the way until Friday morning. In the process, it has recovered much of its losses over the month. Right now, several of the breadth indicators have short-term overbought readings suggesting that a retest of the previous lows could be in the making. If we are to assume that the bull market is only in a correction mode, then it would make sense to take positions on weakness as it nears last Monday’s previous lows. If that retest comes on light volume, then a reversal to the upside is even more likely.
Key underlying short-term timing indicators show the following:
***********
THE BOTTOM LINE: The Fear/Greed Index is currently reading 7 or “Extreme Fear.” This reading suggests that there is plenty of room for the market to rally. This time of year can be particularly tricky, but present several trading opportunities. But not everyone is suited for playing this much volatility and I happen to fall into that category. But a light volume retest of the previous lows would present a lower-risk entry point for the next ride up. But you never know about this market. It may just continue to go straight up from here.
STOCK MARKET STRATEGY FOR OCTOBER 28, 2018: The stock market dropped hard last week taking out support levels in all indices. With several breadth indicators in oversold territory, one would expect another bounce to occur soon. But in terms to sustaining a strong upside rally, I expect more downside with lower lows. If we should get oversold readings in the McClellan Oscillators, I’d want to play a relief rally of several hundred points. That could come sometime next week with a test of the early 2018 lows around 2530 in the S&P 500.
Key underlying short-term timing indicators show the following:
***********
THE BOTTOM LINE: The Fear/Greed Index is currently reading 7 or “Extreme Fear.” It has been in this territory for a few weeks now and is an indicator of a major correction if not the start of a Bear Market. But in “Wall Street Craps” terms, the tables are cold and lots of money can be lost betting heavier on a cold table. So aside from a quick light trade with tight stops, you should keep most of your money on the sidelines.
STOCK MARKET STRATEGY FOR OCTOBER 21, 2018: The stock market has either completed its bounce or is in the process of retesting the previous lows. I have a hunch that whichever direction the market goes on Monday, the rest of the week will do the opposite. So if we get a rally on Monday, I’d be selling into that strength, but conversely I’d be buying on a retest of the lows. Of course this is a gamble, but something that I see as an opportunity for gain.
Key underlying short-term timing indicators show the following:
***********
THE BOTTOM LINE: The Fear/Greed Index is currently reading 14 or “Extreme Fear.” It has been in the this area for over a week and usually doesn’t stay here for more than two weeks. So the market is either going to rally here or is in the middle point of a decline into a lower-risk buying zone before the election.
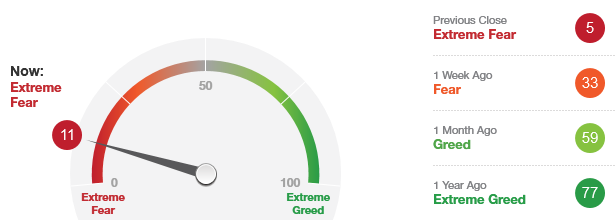 The “Fear/Greed Sentiment Index: What Emotion is Driving the Market Now?” has a current reading of 11 after reaching an even more extreme reading of 5 on Friday. This suggests that the market is within the buying opportunity area.
This indicator has gone down enough but only may need to spend more time in this area before rallying upwards in the coming weeks.
With the internal indicators in “oversold” readings, this suggests that a tradable bottom could occur in this time period – which is within the next two weeks. However, there is always the possibility of one more crash down of obvious “bad news” in order to shake out the weak hands.
STOCK MARKET STRATEGY FOR SEPTEMBER 23, 2018: The market’s rally has continued to push upwards while running into resistance. The current breadth indicators are presently in mid-range (neutral) and suggests that another challenge to new All-Time Highs is likely in the near term. If we should get an “oversold” condition in the coming weeks, it would be worth the risk to trade for another leg of the rally despite the time and extent of this bull run.
Key underlying short-term timing indicators show the following:
***********
THE BOTTOM LINE: The Fear/Greed Index is currently reading 75 or “Extreme Greed.” This doesn’t mean that the market is overbought and time to sell. But it does suggest that it is not the time to buy. That would come on a move to the “Extreme Fear” territory.
STOCK MARKET OBSERVATIONS FOR September 14, 2014: The stock market experienced a mild correction that has put it in a slightly oversold condition. With a little more downside, it could set up a short-term rally to challenge the old highs. In the meantime, interest rates have increased to provide the backdrop for a more significant decline in the coming weeks. I’d expect one final narrow-based rally within reach of the old highs before the stock market makes a steep decline into October-November.
Key underlying market indicators show the following:
***********
My advice for traders and investors is let the market set-up for one last rally in order to move completely to the sidelines. The stock market has experienced a long rally for the majority of 2014 and now is the time to prepare for a meaningful correction both in extent and duration.
***********
MARKET OBSERVATIONS FOR October 27, 2013: The stock market has been marching upwards for the past 13 trading sessions. During this coming week, the time of this rally will have matched the previous downleg and thus, be ripe for a pullback. I would not be surprised to see a new closing high in the Dow Jones Industrial Average sometime next week which would mark the high of this phase of the rally. But current readings of key breadth indicators show that the general market has already begun its correction. That could mean that the correction will be sharp in terms of price, but short in duration.
Key market indicators show the following:
For now, my advice for traders is to be on the sidelines as the stock market peaks this coming week. Since I don’t see a good way to participate on the downside, I’d prefer to wait until the market becomes oversold and then play the next rally. Retests of highs and lows has not been characteristic of this market. Instead, the stock market goes up until it runs out of time and then retreats into a similar reversal. Playing the extremes in breadth oscillators seems like the best way to go….. especially to the upside. And in this market, playing the downside has been a study in frustration and capital loss.