STOCK MARKET STRATEGY FOR NOVEMBER 14, 2020: The stock market rallied strongly Post-Election last week with shorts getting squeezed and a radical rotation into low-performing basic industry stocks. But what happens from here is anyone’s guess. One thing seems certain: high volatility can be expected in these next couple of months and with that come trading opportunities for disciplined, clear-thinking swing traders.
Key underlying short-term timing indicators show the following:
***********
Short-Term Swing Trading Strategy: The market may be heading towards a 27-day cycle high for Wednesday November 18th. The next low would then be projected to Wednesday December 9th which is a 27-day cycle low. If the technicals match up well with this scenario, I’d be looking to make some trading moves to match the rhythm of the market.
Categories: Stock Market Strategy, Stock Market Timing Tags: AAPL, invest, investing, investing tips, investments, QQQ, retirement, SPY, stock action, stock market, stock market timing, stock trading
STOCK MARKET STRATEGY FOR OCTOBER 29, 2020: The stock market is in a clear correction and set up right now as we head into the November election. The internal indicators are mostly oversold or quickly approaching those levels. My guess is that a bounce is coming either today or tomorrow. But the real question will be: what will the market do after Election Day? I answer I expect: It will do the opposite of what it did in the days before.
Key underlying short-term timing indicators show the following:
***********
NYSE McClellan Summation Index: This key trend indicator remains below its 15-day moving average and is expanding to the downside. Because of this indicator, a trader/swing trader should be very careful about waging too much capital on a long-side bet too early.
Categories: Stock Market Strategy, Stock Market Timing Tags: AAPL, invest, investing, investing tips, investments, QQQ, retirement, SPY, stock action, stock market, stock market timing, stock trading
 STOCK MARKET STRATEGY FOR AUGUST 22, 2020: The stock market is hovering near its all-time highs in many indices. But the real strength has been in large tech companies like Apple, Google and Amazon. I suspect there will be one more rally coming soon since some indicators are showing “oversold” reading today.
Key underlying short-term timing indicators show the following:
***********
NYSE McClellan Summation Index: This key trend indicator broke below its 15-day moving average on Friday which has been an early sell signal in the past.
Categories: Stock Market Strategy, Stock Market Timing Tags: AAPL, invest, investing, investing tips, investments, QQQ, retirement, SPY, stock action, stock market, stock market timing, stock trading, stock trading tips
STOCK MARKET STRATEGY FOR JULY 12, 2020: The stock market is near the top of its trading range. After a large gap down last month, the market has held its own for a few weeks now. The question is whether the market will fill that gap soon or head down from here. In any case, it does not appear that a new All-Time High is likely or if it does reach a new high – that will mark the end of the rally since March 23rd.
Key underlying short-term timing indicators show the following:
***********
THE BOTTOM LINE: The stock market’s internal indicators are reading “neutral.” This means that it could go either way from here. The move that I think may happen is a new closing high to fill the June gap, but that high marking the top of this move since March 23rd.
Categories: Stock Market Strategy, Stock Market Timing Tags: AAPL, invest, investing, investing tips, investments, QQQ, retirement, SPY, stock action, stock market, stock market timing, stock trading, stock trading tips
STOCK MARKET STRATEGY FOR JUNE 16, 2020: The stock market made a sharp move downwards on last Thursday and has recovered much of that decline over the last 3 trading days. This sets up the possibility of a Classic Dow Theory and Granville Non-Confirmation sell signal on the next closing high in the Dow Jones Industrial Average. This new unconfirmed high could mark the end of this powerul rally since the March 26th bottom.
Key underlying short-term timing indicators show the following:
***********
THE BOTTOM LINE: The stock market is setting itself up for a possible sell signal on the next closing high in the Dow Jones Industrial Average. That new high would be unconfirmed by the majority of other indicators and particularly the Dow Jones Transportation Average which would need to rally substantially in the next few days. Note: The next closing high may even have one or two additional days to the upside with each day being progressively weaker and more selective.
Categories: Stock Market Strategy, Stock Market Timing Tags: AAPL, invest, investing, investing tips, investments, QQQ, retirement, SPY, stock action, stock market, stock market timing, stock trading, stock trading tips
STOCK MARKET STRATEGY FOR MAY 7, 2020: The stock market has been hovering in a tight trading range for the last couple of weeks. During this time, a few of the internal oscillators have come down to the “oversold” range. That brings the possibility of a short-term bottom in 2 to 3 trading days if the trend continues down. But be careful of a potential crash, too.
Key underlying short-term timing indicators show the following:
***********
THE BOTTOM LINE: The stock market is approaching a possible short-term buying opportunity as the internal indicators move down to oversold readings. But a trader must be careful not to jump the gun since there could be a downside break with momentum or a possible mini-crash.
Categories: Stock Market Strategy, Stock Market Timing Tags: AAPL, invest, investing, investing tips, investments, QQQ, retirement, SPY, stock action, stock market, stock market timing, stock trading, stock trading tips
STOCK MARKET STRATEGY FOR APRIL 11, 2020: Last week,the stock market said “no” to the idea of an immediate retest of the previous lows that so many were expecting. Instead, it went straight up in the face of bad news where it now sits at the halfway point of the entire previous decline. With the internal indicators just below “overbought” levels, one could expect a few more days of strength before the top of this rally can be expected.
Key underlying short-term timing indicators show the following:
***********
THE BOTTOM LINE: The stock market may have a few more days of strength before it corrects this rally phase. It is anyone’s guess whether the market will decline or back and fill. But the stage can be set for an extended rally where the majority missed out at the bottom, the fear of missing out kicks in, and the market climbs the proverbial “wall of worry.”
“The market will do whatever it has to do to embarrass the greatest number of people to the greatest extent possible.” — Walter Deemer’s Law Of Perversity
Categories: Stock Market Strategy, Stock Market Timing Tags: AAPL, invest, investing, investing tips, investments, QQQ, retirement, SPY, stock action, stock market, stock market timing, stock trading, stock trading tips
STOCK MARKET STRATEGY FOR MAY 13, 2019: Note: I was ready to post this after Monday’s decline. These were the readings on that day’s close after a brutal decline. But in truth, I was looking for a follow through on Tuesday morning to fade a buy into. But Tuesday opened up and I never capitalized on this minor short-term buy signal.
Key underlying short-term timing indicators show the following:
***********
THE BOTTOM LINE: The stock market gave us a brief buy point at the end of Monday’s close, but it would have been tricky to catch. This is another piece of evidence that short-term trading is difficult to do in today’s environment. It’s better to wade in with smaller units as opportunities present themselves. You will go crazy trying to catch the perfect time to buy and thus, it is unwise to make large bets with the expectation of a short-term turnaround.
Categories: Stock Market Strategy, Stock Market Timing Tags: AAPL, invest, investing, investing tips, investments, retirement, SPY, stock action, stock market, stock market timing, stock trading, stock trading tips, stocks, tony robbins, trading advice
STOCK MARKET STRATEGY FOR JULY 14, 2018: The market presented a tricky, short-term trading opportunity on July 3rd. It came from a semi-oversold condition which suggests that the rally will not be strong. So far, it appears as if the market can still go in either direction with the same degree of certainty. This is a time to be on the sidelines waiting for the next opportunity to set up. The Volatility Indicator will have to traverse across its oscillator from “overbought” to “oversold” which will probably take over a week to happen.
Key underlying short-term timing indicators show the following:
***********
THE BOTTOM LINE: The Fear/Greed Index is currently reading 47 or “neutral.” I’m still awaiting for a quick move into the “Extremely Fear” area in order to feel like the conditions are ripe for a more sustainable rally. So, we continue to wait for a better trading opportunity to the upside.
Categories: Stock Market Strategy Tags: AAPL, buy low sell high, ETF, invest, investing, investing tips, market timing, money, QQQ, stock market timing, stock market trading tips, stock trading tips, stocks, wall street
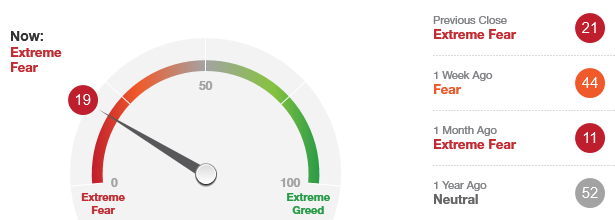 The “Fear/Greed Sentiment Index: What Emotion is Driving the Market Now?” reading has a current reading of 19 which is in the “Extreme Fear” zone. This suggests that the market is in a buying range and not a selling range. Tactically, this means that you should either buy or hold depending on your situation.
This indicator ventured out into the “Fear” area about a week ago, but has returned back into the “Extreme Greed” zone once again. My guess is that this indicator will not stay in the “Extreme Greed” area very long since it has already spent an abnormally long period of time in it last month.
I would look to buy weakness especially if we should receive oversold readings in breadth indicators, moves toward major indexes 200-day moving averages or retests of previous correction lows. While it is hard to say how much higher the general market can go up from here, the important thing to keep in mind is that this market has been correcting for a long enough time to support a healthy multi-month rally.
Categories: Fear & Greed Index Tags: AAPL, AMZN, bonds, EFT, equities, invest, investing, investments, mutual funds, retirement, stock market, stocks, tony robbins, trading, wealth mastery