The stock market declined this past week with only one day to the upside. The market is due for a relief rally that may get started early next week. But this next rally may be setting up the market for a large drop after this temporary buying subsides. My guess is that the market will be very tricky to trade in the coming week. And for many people especially those who want to go long, this may be a good time to avoid the market until a more pronounced bottom has been tested and formed.
Key underlying short-term timing indicators show the following:
NYSE McClellan Summation Index: This indicator is trending sharply lower with a current reading of 33. It should reach the oversold territory in one more trading day.
Fear/Greed Index: This popular indicator is in the “Fear” territory with a reading of 41. A reading below 25 is needed for a tradable low based on this sentiment indicator. This indicator is several days away from signalling a bottom.
The stock market has declined sharply from its rally highs only one week ago. The short term oscillators are all in oversold territory suggesting that a bounce is due at any time now. Perhaps, Wednesday will be a day that opens lower, scares bulls into dumping, and turning around for a positive close. But where the market goes on an intermediate term basis is anyone’s guess at this time.
Key underlying short-term timing indicators show the following:
NYSE McClellan Summation Index: This indicator has a current reading of 74 which is just coming out of overbought territory. This suggests that an intermediate term bottom has not had enough time to set up and any trades on the long side are for short-term speculation only.
Fear/Greed Index: This popular indicator is in the “Neutral” territory with a reading of 45. A reading below 25 is needed for a tradable low based on this sentiment indicator.
The stock market has been staying above its June lows in the face of horrible news on the inflation/interest rate front. The rally so far from the June lows has not been very impressive, but the internal indicators are setting up for a possible tradable low on either Monday or Tuesday of next week. So keep your powder dry and buy into weakness early next week for a possible rally into August. Overall, the odds look good for decent bet to the upside.
Key underlying short-term timing indicators show the following:
NYSE McClellan Summation Index: This indicator has a current reading of 55. It is just now starting to trend down which is not in tune with a tradable low early next week.
Fear/Greed Index: This popular indicator is in the “Extreme Fear” territory with a reading of 24. This may be low enough to confirm a “retest low” for early next week.
The stock market has turned sharply lower after the FED announcement of its latest interest rate hike. The one day rally before this announcement was preceded by a couple of gap down market days. But in the process, the internal indicators are now all in “oversold” territory which signifies that a market bottom is likely to occur. This is particularly true in “Bull Markets,” but in “Bear Markets” these kind of oversold conditions are often a signal that a “Stock Market Crash” is about to happen. Because of this, it would be smart to wait until next week for a possible bottom following a “stock market crash” on Monday or Tuesday.
Key underlying short-term timing indicators show the following:
NYSE McClellan Summation Index: This indicator has a current reading of 46 but still needs a few more days before reaching the buying zone. Thus, it is saying that the market needs more time in order to find a bottom and in the meantime it could continue on its sharp downward path.
Fear/Greed Index: This popular indicator is in the “Extreme Fear” territory with a reading of 14. Recent intermediate-term market bottoms have had readings under 5.
The stock market has turned sharply lower since its midweek highs of last week. There have been 3 strong moves down with only a temporary reprise on Monday. Momentum seems to be suggesting that buying this drop will be akin to “catching a falling knife.” However, the internal indicators are either approaching or are within the oversold range suggesting a bounce in the near term. The timing of that bounce could be either be this coming Friday or Monday for those interested in a quick high risk trade with tight stops to the upside.
Key underlying short-term timing indicators show the following:
NYSE McClellan Summation Index: This indicator has a current reading of 39 but still needs a few more days before reaching the buying zone. But mostly, this indicator is showing that there has not been base building for any kind of sustained rally. Thus, it suggests that even a sharp bounce will be short-lived.
Fear/Greed Index: This popular indicator is in the “Fear” territory with a reading of 26 which is one point away from “Extreme Fear.” The strength of this decline suggests to me that we may finally get a sub-10 reading in this indicator when the market finally bottoms. And if it does so, then there could be a low-risk rally worth participating in. But right now, I’d expect only short-term bounces with high risk upside trades.
The stock market has turned in a spectacular rally in the face of bad news climbing the proverbial “Wall of Worry.” With a few internal indicators getting in the “overbought” range, you could expect some downward or sideways action over the near term. But the intermediate term (next few months) is still anyone’s guess. The Elliott Wave followers are looking for continued higher prices, while other’s see a limit to the upside and plenty of economic reasons for it to go down. Personally, I am waiting for another good set up like we had two weeks ago in order to make a good bet with strong odds.
Key underlying short-term timing indicators show the following:
NYSE McClellan Summation Index: This indicator had an “oversold” reading of 29 on March 12, just two days before the bottom. It had been in the oversold area for several weeks and the dots were “clumping” in a basing area. So when the market turned decisively to the upside these past two weeks, you could expect that move to be sustained. So buy the dips!
Fear/Greed Index: This popular indicator is in the “Neutral” territory with a reading of 49. This means that the general market can go up or down with an even probability. So it is not an optimal time to go long or go short. Note: This indicator got an “Extreme Fear” reading of 17 in mid-March which at the time did not seem low enough to a climatic bottom. So instead we got an exhaustion to the downside with too much pessimism and negative news that created a decent trading bottom. Has this been a “Bear Market Rally” or the start of a new “Bull Market?” That’s the question for many.
The stock market had a mild down week against a challenging news backdrop and thus sets itself up for either a strong move up or down in the near term. My hunch is that the market will do both in the coming week or two. And that is a strong move down followed by a strong move up. But catching the final bottom in this scenario is bound to be tricky. Unless you are an experienced trader, it might be smarted to control your risk with smart “betting strategies” – buy even chip size over an even time frame in active ETF positions. Anticipate a possible scary plunge and reversal based on “obvious bad news.”
Key underlying short-term timing indicators show the following:
NYSE McClellan Summation Index: This indicator has a current “oversold” reading of 29. It has been in the oversold area for several weeks and the dots are clumping in a basing area. When the market turns decisively to the upside, expect that move to be sustained.
Fear/Greed Index: This popular indicator is in the “Extreme Fear” territory with a reading of 14. It has been in this territory for several days now and only needs to continue going down towards a sub-5 reading ideally. That could happen in the next week or so with the negative news background and the gradually declining sentiment.
The stock market has made a strong rebound from the deeply oversold bottom from late February’s invasion day. But that momentum appears to be waning with the prospect of more weakness over the near-term. The internal indicators are in middle ground suggesting that the general market is not deeply oversold or overbought. Therefore, the short-term market direction is up for grabs. With the general climate of the market, I would favor a retest of the late February lows with enough bad news to scare the weak Bulls to capitulate. That climatic bottom could come in the next 5-8 trading sessions.
Key underlying short-term timing indicators show the following:
NYSE McClellan Summation Index: This indicator is still bottoming after a long decline for many weeks now, but it is starting to turn up. This points to a possible intermediate term bottom or powerful bounce in the making.
Fear/Greed Index: This popular indicator is in the “Extreme Fear” territory with a reading of 17. It has taken a lot of time to get this index into the “Extreme Fear” range, but it now has the possibility of going to the sub-5 reading that has often marked the bottom of major moves in the recent past. This index is telling us to get ready for a possible buy signal on a scary retest of the February lows.
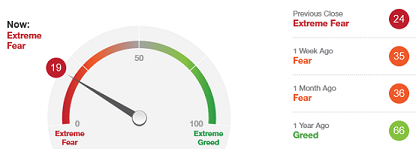
The Fear & Greed Index moved strongly into “Extreme Fear” territory today with a reading of 19. Solid intermediate-term bottoms have occurred when this indicator gets as low as 2 or 3. There is a chance that this indicator is setting up for such an occurrence during next week. That provides enough time for more bad news to hit bullish investors into dumping their holdings at the bottom in a brief period of maximum fear.
The stock market had an extremely memorable shorten week with the invasion of Ukraine news backdrop. After a climatic bottom on Thursday’s opening, the market rallied strongly during the remainder of the day and on the following Friday. It was a classic bad news bottom and many are wondering if that was THE BOTTOM or whether there will be a retest in the coming weeks. These are turbulent times and for those with a weak stock market stomach, this may be a time to sit on the sidelines. Another good time to go long could be on a retest of last week’s low.
Key underlying short-term timing indicators show the following:
NYSE McClellan Summation Index: This indicator has been bottoming after a long decline for many weeks now. It is hard to see any reliable signal here as it may still fall off the cliff and go to a lower bottoming level. But overall, it says that the risk is in trying to short this market as strange as that may seen.
Fear/Greed Index: This popular indicator is only in the “Fear” territory with a reading of 31. At the December 2018 bottom, this indicator reached a reading of 3. This week it reach an “Extreme Fear” reading of 25 which is just barely in this territory. I would expect a much lower reading if this is to be the final bottom and gives me the strong conviction that we still have more downside to go.
Neither the information nor the opinions expressed should be construed as a solicitation to buy or sell any Exchange-Traded Fund, stock, option, mutual fund, currency or commodity. Past performance is not necessarily indicative of future results. You may lose money trading and investing. Trade at your own discretion: we don't share in your profits, so we don't share in your losses. We may have a financial interest in one or more of the securities discussed in this blog. Investors should obtain the advice of a qualified investment advisor before entering into any transactions. This blog serves as an educational and entertainment website only. We are not Registered Investment Advisors and do not in any way claim to be either.