The stock market has declined sharply from its rally highs only one week ago. The short term oscillators are all in oversold territory suggesting that a bounce is due at any time now. Perhaps, Wednesday will be a day that opens lower, scares bulls into dumping, and turning around for a positive close. But where the market goes on an intermediate term basis is anyone’s guess at this time.
Key underlying short-term timing indicators show the following:
***********
NYSE McClellan Summation Index: This indicator has a current reading of 74 which is just coming out of overbought territory. This suggests that an intermediate term bottom has not had enough time to set up and any trades on the long side are for short-term speculation only.
Fear/Greed Index: This popular indicator is in the “Neutral” territory with a reading of 45. A reading below 25 is needed for a tradable low based on this sentiment indicator.
Categories: Stock Market Strategy, Stock Market Timing Tags: 401k, annuities, insurance, investing, investing tips, investments, life insurance, money, pension plan, QQQ, retirement, SPY, stock action, stock market, stock trading, stock trading tips, stocks, tony robbins, trading, trading tips
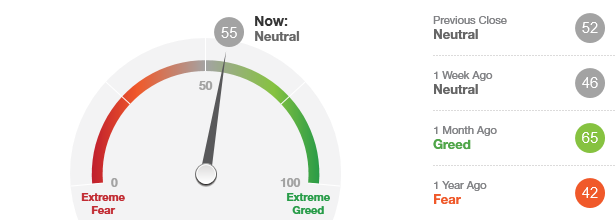 This indicator is labeled as being in the “Neutral” zone right now. Ideal buying opportunities have only occurred when the general market has been in the “Extreme Fear” zone. This suggests that the market needs more time and greater fear in order to set itself up for a better intermediate-term buying opportunity. (Source: http://money.cnn.com/data/fear-and-greed)
Categories: Fear & Greed Index Tags: 401k, annuities, insurance, investing, investing tips, investments, life insurance, money, pension plan, QQQ, retirement, SPY, stock action, stock market, stock trading, stock trading tips, stocks, tony robbins, trading, trading tips, wall street
 STOCK MARKET STRATEGY FOR OCTOBER 3, 2016: The stock market has been climbing and dropping in the same price range for several weeks now. There isn’t a clear trend and the current market is neutral in terms of overbought vs. oversold. With the national election only a month away, I suspect that the markets will make a clearer trend before and then afterwards. So if we rally into the election, expect the opposite to occur after the election and vice versa. For now, keep your powder dry and wait for a better entry point.
Key underlying short-term market indicators show the following:
***********
THE BOTTOM LINE: The internal indicators are neutral and trending down slightly. This would suggest that the market is likely to decline over the near term with the chance of reaching an oversold condition shortly. That would set up a rally to challenge and maybe exceed the all-time highs as we approach the elections. But right now isn’t an attractive time to buy unless we can get some more bearishness and lower prices.
Categories: Stock Market Strategy Tags: 401k, annuities, insurance, investing, investing tips, investments, life insurance, money, pension plan, QQQ, retirement, SPY, stock action, stock market, stock trading, stock trading tips, stocks, tony robbins, trading, trading tips, wall street
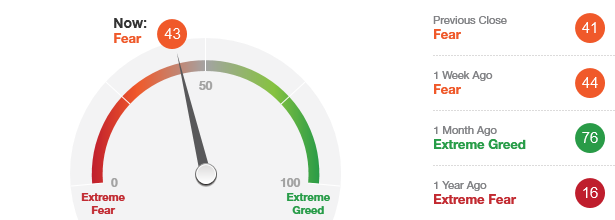 While this indicator is labeled as being in the “Fear” zone, the ideal buying opportunities have occurred when the general market has been in the “Extreme Fear” zone. This suggests that the market needs more time and greater fear in order to set itself up for a better intermediate-term buying opportunity. (Source: http://money.cnn.com/data/fear-and-greed)
Categories: Fear & Greed Index Tags: 401k, annuities, insurance, investing, investing tips, investments, life insurance, money, pension plan, QQQ, retirement, SPY, stock action, stock market, stock trading, stock trading tips, stocks, tony robbins, trading, trading tips, wall street
STOCK MARKET STRATEGY FOR SEPTEMBER 18, 2016: The stock market has retreated and bounced around for the last few weeks. The internal indicators are near the lower range and could reach oversold readings if the market should fall in the coming days. Look for weakness early this week with the opportunity to buy near the end of the week for another run to new highs. If that scenario doesn’t set up that way, then step aside and let the market create a different kind of opportunity further down the road.
Key underlying short-term market indicators show the following:
***********
THE BOTTOM LINE: The internal indicators are neutral but within range of a bottom. While the readings have not been very severe to the downside, the length of time in this lower range suggests that a move up should be coming soon. It is based on that factor, that I’d be ready to move into action should we see weakness at the beginning of next week.
Categories: Stock Market Strategy Tags: 401k, annuities, insurance, investing, investing tips, investments, life insurance, money, pension plan, QQQ, retirement, SPY, stock action, stock market, stock trading, stock trading tips, stocks, tony robbins, trading, trading tips, wall street
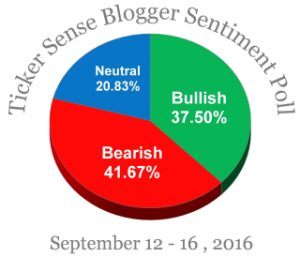 There has been an important shift in sentiment as the bears now outnumber the bulls 41.67% to 37.50%. This is one of the first prerequisites to forming an intermediate-term bottom. Now we need some more downside action to produce a higher degree of fear and for the internal breadth indicators to move into a deeply oversold area. That could happen as early as Friday, but more likely next week sometime. My guess is that the “Brexit Bottom” will hold and even serve as the most extreme lower boundary for any spike down in price.
Categories: Blogger Sentiment Tags: 401k, annuities, insurance, investing, investing tips, investments, life insurance, money, pension plan, QQQ, retirement, SPY, stock action, stock market, stock trading, stock trading tips, stocks, tony robbins, trading, trading tips, wall street
STOCK MARKET STRATEGY FOR SEPTEMBER 5, 2016: The stock market reached a short-term low intraday on Wednesday. Since that time, the internal oscillators have been trending up. This has been a sideways correction with the Dow remaining in a 300-point trading range for 38 straight trading days. Another new closing high in the coming week is certainly possible. But overall, the market did not become oversold enough or create enough of a sentiment shift to fuel the market towards a big move upwards.
Key underlying short-term market indicators show the following:
***********
THE BOTTOM LINE: The internal indicators are all trending up after last Wednesday’s bottom. That gives the general market time to rally more and reach new high ground. But since the market did not become deeply oversold, I would be careful about being either long or short with any significant positions. A better risk/reward opportunity should present itself in the coming months which historically has been volatile. Keep your powder dry instead.
Categories: Stock Market Strategy, Uncategorized Tags: 401k, annuities, insurance, investing, investing tips, investments, life insurance, money, pension plan, QQQ, retirement, SPY, stock action, stock market, stock trading, stock trading tips, stocks, tony robbins, trading, trading tips, wall street
STOCK MARKET STRATEGY FOR AUGUST 24, 2016: The stock market’s drop today has sent the breadth oscillators downwards towards a possible oversold condition by the beginning of next week. At this point, the market may begin to show more weakness and finally give us a clear pattern from which to trade from. So keep your powder dry and be ready to take positions in case an oversold scenario starts to take shape.
Key underlying short-term market indicators show the following:
***********
THE BOTTOM LINE: The internal indicators show that the market is finally trending downwards in unison. With today’s action, we have a pattern that may lead to a buying opportunity very shortly. This will probably be a “V-shaped” bottom without any kind of retest so be ready to take action on weakness in a few days. It may even be a spike down towards a key 200-day moving average which chartists will point to as being the pivot point. So be ready for a short-term trade on the long-side if the market sets up that way.
Categories: Stock Market Strategy Tags: 401k, annuities, insurance, investing, investing tips, investments, life insurance, money, pension plan, QQQ, retirement, SPY, stock action, stock market, stock trading, stock trading tips, stocks, tony robbins, trading, trading tips, wall street
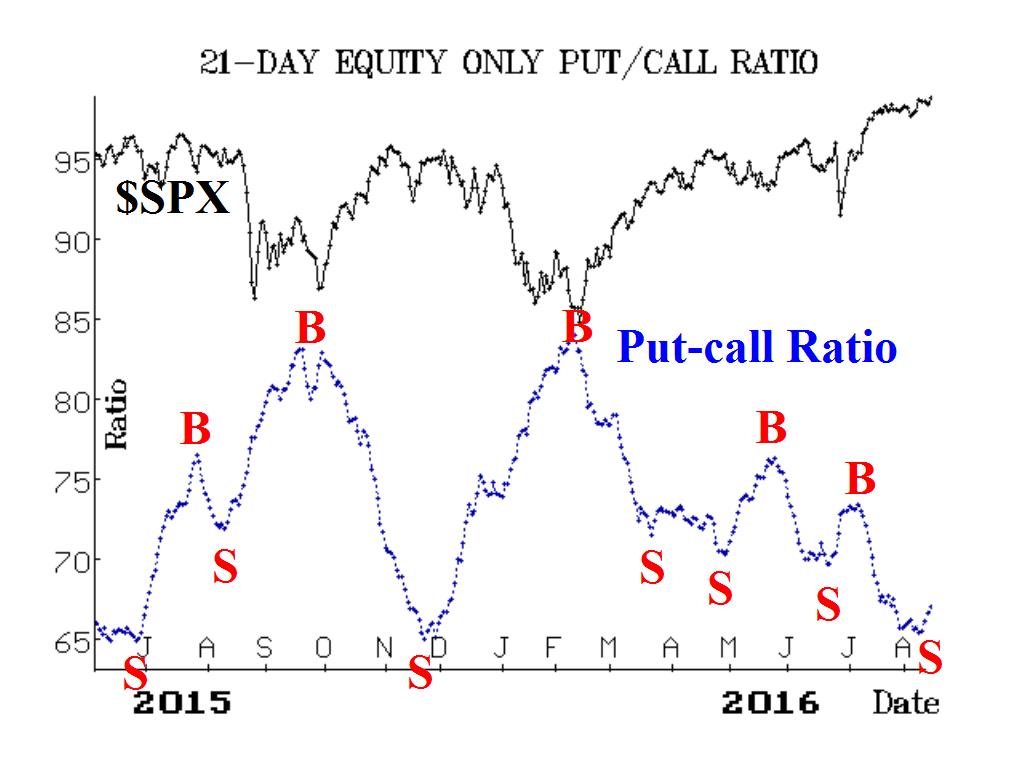
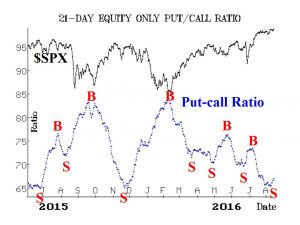 The stock market appears to be at the very end of its rally since February 11, 2016. The only thing that prevents me from being downright bearish, is the possibility that the Brexit bottom may have already flushed out the weak hands and created an intermediate-term low. But most of all, this indicator makes an investor or trader aware of the risks to holding long positions in the general market at this time. Better odds for upside appreciation seems likely at another time down the road. (Source: www.optionstrategist.com)
Categories: Put/Call Ratio Timing Indicator Tags: 401k, annuities, insurance, investing, investing tips, investments, life insurance, money, pension plan, QQQ, retirement, SPY, stock action, stock market, stock trading, stock trading tips, stocks, tony robbins, trading, trading tips, wall street
STOCK MARKET STRATEGY FOR MAY 28, 2016: The stock market recovered 3 weeks worth of correction in just 2 days! But now it is reaching overbought levels which puts a lid on further advances for the time being. But after a short, mild, or sideways correction, a move to new highs is very possible. Perhaps it has more to do with time than price. By that I mean, that the market needs a week to correct its move and it doesn’t matter how many points it goes down. What matters is that a buying opportunity is likely during the second week of June and it would be wise to prepare for it.
Key underlying short-term market indicators show the following:
***********
THE BOTTOM LINE: The stock market needs a breather. The upside is limited from here as the internal indicators are near or at overbought levels. But after some time spent going down or sideways, there might be a good entry point to ride this market to new highs. Be prepared for a buying opportunity during the second week of June.
Categories: Stock Market Strategy Tags: insurance, investing, investments, life insurance, money, pension plan, QQQ, retirement, SPY, stock action, stock market, stock trading, stock trading tips, stocks, tony robbins, trading, trading tips, wall street