STOCK MARKET STRATEGY FOR OCTOBER 22, 2016: The stock market is in a neutral trading range as it sets itself up for a possible big move around Election Day. The internal breadth indicators are trending up suggesting that a minor short-term top could occur during the coming week. Then we could have a final drop into a low about November 7-9. Now would be a good time to get yourself ready to participate in a year-end rally of significance. But first, beware of news that will trick the public into selling right at the turning point…alas the Brexit vote.
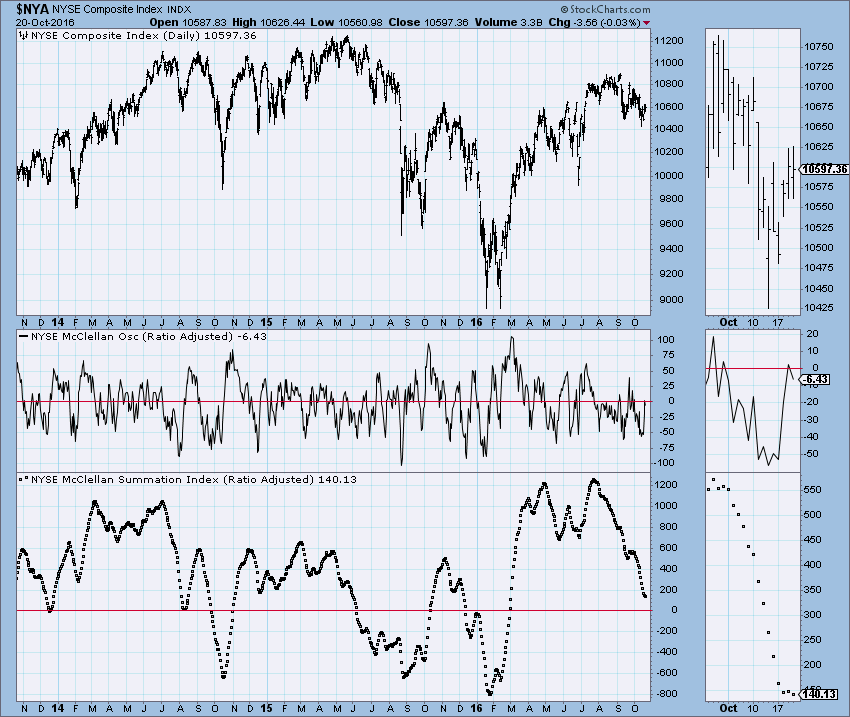
Key underlying short-term market indicators show the following:
***********
THE BOTTOM LINE: The internal breadth and sentiment indicators such as the Fear/Greed Index and the Blogger Sentiment Poll are in neutral positions. Before a sustained move in either direction, we need these indicators to go to an extreme. That takes time which means that nothing of significance will occur in the general market for a few weeks.
Categories: Stock Market Strategy Tags: investing, investments, money, QQQ, retirement, SPY, stock action, stock market, stock trading, stocks, tony robbins, trading, wall street
 Looking at the bottom chart of the Summation Index, I’d be very careful about trying to catch the bottom of this move. It looks like a giant head-and-shoulder top to me. That means a lot more time devoted to the downside and a reading of -400 minimum. After it crosses the -400 reading, you have about a 1-2 weeks lead-time before the final bottom is reached. And as we all know, the exact bottom is usually very tricky to catch….better to scale-in on the final leg down.
Categories: Stock Market Strategy Tags: investing, investments, money, QQQ, retirement, SPY, stock action, stock market, stock trading, stocks, tony robbins, trading, wall street
STOCK MARKET STRATEGY FOR OCTOBER 16, 2016: The stock market is approaching oversold readings in all of the internal breadth indicators that I monitor. This suggests that a rally is possible next week after further initial weakness in the overall stock market. With the Fear/Greed Sentiment Index within range of an “Extreme Fear” reading, it certainly appears likely that, given additional weakness, a short-to-intermediate term bottom is near. So be ready to commit new funds to the long side if that should happen for a quick ride up to challenge the all-time highs.
Key underlying short-term market indicators show the following:
***********
THE BOTTOM LINE: The internal breadth and sentiment indicators suggest that the market is becoming both oversold and under-loved. This could create the conditions for a short-term bottom that will set the stage for a new rally to challenge the all-time highs. If we get weakness on Monday and/or Tuesday, this might be a good time to re-enter the market on the long side.
Categories: Stock Market Strategy Tags: investing, investments, money, QQQ, retirement, SPY, stock action, stock market, stock trading, stocks, tony robbins, trading, wall street
STOCK MARKET STRATEGY FOR OCTOBER 9, 2016: The stock market continues its slow choppy move sideways to lower. With the uncertainty about the election and interest rates, this should not be too much of a surprise. But I sense that the first move in either direction will be a set up for a reversal around election time. So if the market retreats into early November, expect it to rally afterwards and vice versa. Right now, it looks like a move lower into an oversold condition before the next rally.
Key underlying short-term market indicators show the following:
***********
THE BOTTOM LINE: The internal indicators are trending lower and getting close to the buy range. If the election becomes tighter with a strong hint that Trump may win, then the market may have its “cover story” to go lower into an oversold condition. But most of all, the markets are generally neutral and can go in either direction with about the same degree of certainty. Therefore, it’s a time to do nothing!
Categories: Stock Market Strategy Tags: investing, investments, money, QQQ, retirement, SPY, stock action, stock market, stock trading, stocks, tony robbins, trading, wall street
STOCK MARKET STRATEGY FOR OCTOBER 3, 2016: The stock market has been climbing and dropping in the same price range for several weeks now. There isn’t a clear trend and the current market is neutral in terms of overbought vs. oversold. With the national election only a month away, I suspect that the markets will make a clearer trend before and then afterwards. So if we rally into the election, expect the opposite to occur after the election and vice versa. For now, keep your powder dry and wait for a better entry point.
Key underlying short-term market indicators show the following:
***********
THE BOTTOM LINE: The internal indicators are neutral and trending down slightly. This would suggest that the market is likely to decline over the near term with the chance of reaching an oversold condition shortly. That would set up a rally to challenge and maybe exceed the all-time highs as we approach the elections. But right now isn’t an attractive time to buy unless we can get some more bearishness and lower prices.
Categories: Stock Market Strategy Tags: 401k, annuities, insurance, investing, investing tips, investments, life insurance, money, pension plan, QQQ, retirement, SPY, stock action, stock market, stock trading, stock trading tips, stocks, tony robbins, trading, trading tips, wall street
STOCK MARKET STRATEGY FOR SEPTEMBER 18, 2016: The stock market has retreated and bounced around for the last few weeks. The internal indicators are near the lower range and could reach oversold readings if the market should fall in the coming days. Look for weakness early this week with the opportunity to buy near the end of the week for another run to new highs. If that scenario doesn’t set up that way, then step aside and let the market create a different kind of opportunity further down the road.
Key underlying short-term market indicators show the following:
***********
THE BOTTOM LINE: The internal indicators are neutral but within range of a bottom. While the readings have not been very severe to the downside, the length of time in this lower range suggests that a move up should be coming soon. It is based on that factor, that I’d be ready to move into action should we see weakness at the beginning of next week.
Categories: Stock Market Strategy Tags: 401k, annuities, insurance, investing, investing tips, investments, life insurance, money, pension plan, QQQ, retirement, SPY, stock action, stock market, stock trading, stock trading tips, stocks, tony robbins, trading, trading tips, wall street
STOCK MARKET STRATEGY FOR SEPTEMBER 5, 2016: The stock market reached a short-term low intraday on Wednesday. Since that time, the internal oscillators have been trending up. This has been a sideways correction with the Dow remaining in a 300-point trading range for 38 straight trading days. Another new closing high in the coming week is certainly possible. But overall, the market did not become oversold enough or create enough of a sentiment shift to fuel the market towards a big move upwards.
Key underlying short-term market indicators show the following:
***********
THE BOTTOM LINE: The internal indicators are all trending up after last Wednesday’s bottom. That gives the general market time to rally more and reach new high ground. But since the market did not become deeply oversold, I would be careful about being either long or short with any significant positions. A better risk/reward opportunity should present itself in the coming months which historically has been volatile. Keep your powder dry instead.
Categories: Stock Market Strategy, Uncategorized Tags: 401k, annuities, insurance, investing, investing tips, investments, life insurance, money, pension plan, QQQ, retirement, SPY, stock action, stock market, stock trading, stock trading tips, stocks, tony robbins, trading, trading tips, wall street
STOCK MARKET STRATEGY FOR AUGUST 24, 2016: The stock market’s drop today has sent the breadth oscillators downwards towards a possible oversold condition by the beginning of next week. At this point, the market may begin to show more weakness and finally give us a clear pattern from which to trade from. So keep your powder dry and be ready to take positions in case an oversold scenario starts to take shape.
Key underlying short-term market indicators show the following:
***********
THE BOTTOM LINE: The internal indicators show that the market is finally trending downwards in unison. With today’s action, we have a pattern that may lead to a buying opportunity very shortly. This will probably be a “V-shaped” bottom without any kind of retest so be ready to take action on weakness in a few days. It may even be a spike down towards a key 200-day moving average which chartists will point to as being the pivot point. So be ready for a short-term trade on the long-side if the market sets up that way.
Categories: Stock Market Strategy Tags: 401k, annuities, insurance, investing, investing tips, investments, life insurance, money, pension plan, QQQ, retirement, SPY, stock action, stock market, stock trading, stock trading tips, stocks, tony robbins, trading, trading tips, wall street
STOCK MARKET STRATEGY FOR AUGUST 14, 2016: The stock market has reached the top of its trading once again by posting a new all-time high on Thursday. The market may back and fill for a few more days before making what I believe will be one more new high for this move. From that new high, we should see a more substantial correction in terms of price and time. That next correction will be a dip worth buying as it will likely come back to new all-time highs once again.
Key underlying short-term market indicators show the following:
***********
THE BOTTOM LINE: We are in a neutral internal market, but at the top of the trading range. We can expect the market to either pause before making a new high this week or else push forward with a series of new highs on weakening strength. That should set-up a correction over the next few weeks and present a low risk buying opportunity for another ride up to new highs. So expect the market goes into a correction after a push to new highs this week that will become a buying opportunity worth betting on a few weeks from now.
Note: Another sign of a top is a key reversal on high volume where the market opens up strongly, reverses in mid-session, and then closes convincingly on the downside.
Categories: Stock Market Strategy Tags: insurance, investing, investments, life insurance, money, pensions, retirement, stock action, stock market, stock trading, stock trading tips, stocks, tony robbins, trading, trading tips, wall street
STOCK MARKET STRATEGY FOR AUGUST 7, 2016: The stock market followed last week’s scenario and is now in a position to make new all-time highs. The internal market is not overbought so that any strength can continue for another week to 10 days without triggering much of an overbought signal. However, if new highs reveal widespread weakness in the general market, it would provide a good opportunity to move to the sidelines and wait for the next high-percentage set-up.
Key underlying short-term market indicators show the following:
***********
THE BOTTOM LINE: Last week I wrote the following: The stock market has been chewing up time and consolidating its gains from the Brexit lows. The internal indicators show that the general market is within reach of oversold readings. This presents an interesting situation where the price levels would appear to be too high, but the internal market shows that it’s getting set up for more upside. At the very least, I’d expect a retest of the previous highs and show us clues of either strength or weakness.
That has panned out pretty much as expected. But where do we go from here?
We are right near the area of the previous highs and new highs are certainly likely given the fact that a moderate oversold condition was achieved only 2 trading sessions ago. So timewise, the market can continue upwards for another week or two without become overbought. So resist the idea of going short and let the market show us whether the new highs are achieved with strength or weakness. Then you can determine if is a “bull trap” or not.
Categories: Stock Market Strategy Tags: nsions, retirement, stock action, stock market, stock trading, stock trading tips, stocks, tony robbins, trading, trading tips, wall street