This sentiment indicator shows Bullish Sentiment at 45.83% and Non-Bullish Sentiment (Bearish + Neutral) at 54.17%. With this largely even spread between the bullish and non-bullish market stances among stock market bloggers, the general market can be deemed as “neutral” overall. That means that the market can go in either direction without bias. (Source: Ticker Sense)
Categories: Blogger Sentiment Tags: insurance, investing, investments, life insurance, money, pensions, retirement, stock action, stock market, stock trading, stock trading tips, stocks, tony robbins, trading, trading tips, wall street
 STOCK MARKET STRATEGY FOR AUGUST 24, 2016: The stock market’s drop today has sent the breadth oscillators downwards towards a possible oversold condition by the beginning of next week. At this point, the market may begin to show more weakness and finally give us a clear pattern from which to trade from. So keep your powder dry and be ready to take positions in case an oversold scenario starts to take shape.
Key underlying short-term market indicators show the following:
***********
THE BOTTOM LINE: The internal indicators show that the market is finally trending downwards in unison. With today’s action, we have a pattern that may lead to a buying opportunity very shortly. This will probably be a “V-shaped” bottom without any kind of retest so be ready to take action on weakness in a few days. It may even be a spike down towards a key 200-day moving average which chartists will point to as being the pivot point. So be ready for a short-term trade on the long-side if the market sets up that way.
Categories: Stock Market Strategy Tags: 401k, annuities, insurance, investing, investing tips, investments, life insurance, money, pension plan, QQQ, retirement, SPY, stock action, stock market, stock trading, stock trading tips, stocks, tony robbins, trading, trading tips, wall street
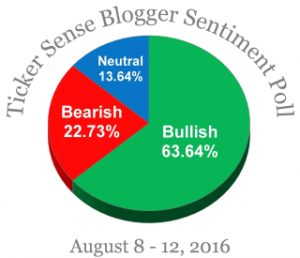
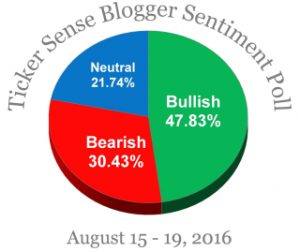 This sentiment indicator shows that the stock market is more bullish than bearish, but not as much as last week. In fact, the non-bullish elements of “neutral” and “bearish” add up to 52% of the survey. So based on the history of this indicator, the market is relatively neutral from a behavioral/sentiment perspective. This means that despite the long run-up since February 11, 2016, the market still has room to continue higher. (Source: Ticker Sense)
Categories: Blogger Sentiment Tags: insurance, investing, investments, life insurance, money, pensions, retirement, stock action, stock market, stock trading, stock trading tips, stocks, tony robbins, trading, trading tips, wall street
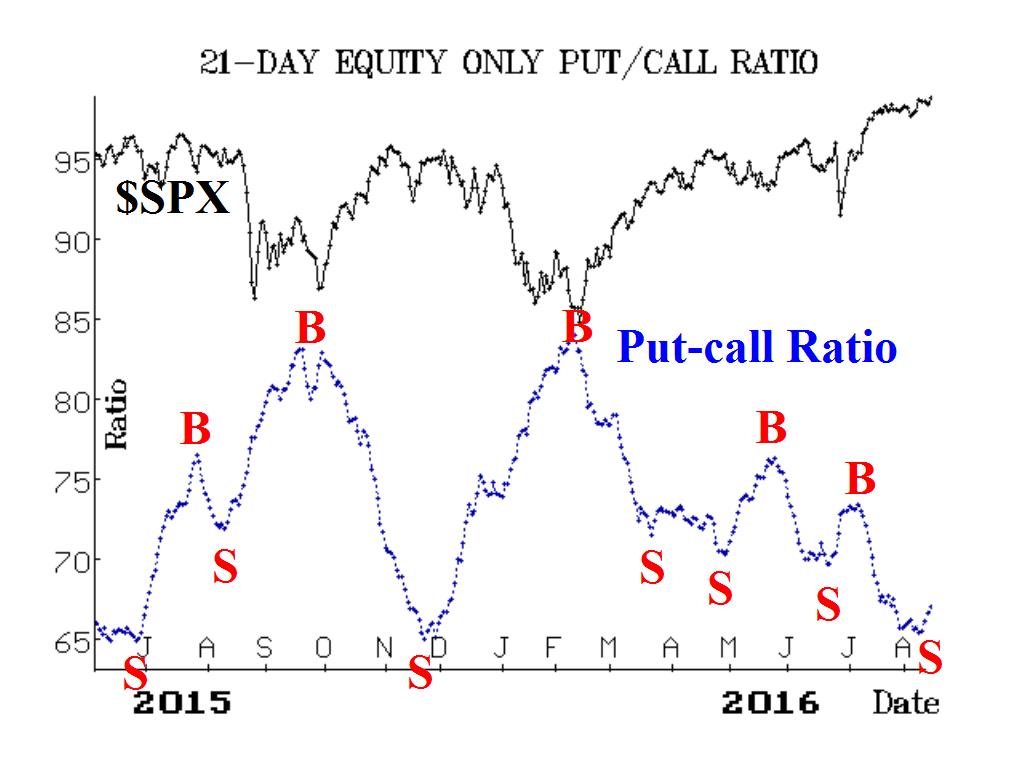
 The stock market appears to be at the very end of its rally since February 11, 2016. The only thing that prevents me from being downright bearish, is the possibility that the Brexit bottom may have already flushed out the weak hands and created an intermediate-term low. But most of all, this indicator makes an investor or trader aware of the risks to holding long positions in the general market at this time. Better odds for upside appreciation seems likely at another time down the road. (Source: www.optionstrategist.com)
Categories: Put/Call Ratio Timing Indicator Tags: 401k, annuities, insurance, investing, investing tips, investments, life insurance, money, pension plan, QQQ, retirement, SPY, stock action, stock market, stock trading, stock trading tips, stocks, tony robbins, trading, trading tips, wall street
STOCK MARKET STRATEGY FOR AUGUST 14, 2016: The stock market has reached the top of its trading once again by posting a new all-time high on Thursday. The market may back and fill for a few more days before making what I believe will be one more new high for this move. From that new high, we should see a more substantial correction in terms of price and time. That next correction will be a dip worth buying as it will likely come back to new all-time highs once again.
Key underlying short-term market indicators show the following:
***********
THE BOTTOM LINE: We are in a neutral internal market, but at the top of the trading range. We can expect the market to either pause before making a new high this week or else push forward with a series of new highs on weakening strength. That should set-up a correction over the next few weeks and present a low risk buying opportunity for another ride up to new highs. So expect the market goes into a correction after a push to new highs this week that will become a buying opportunity worth betting on a few weeks from now.
Note: Another sign of a top is a key reversal on high volume where the market opens up strongly, reverses in mid-session, and then closes convincingly on the downside.
Categories: Stock Market Strategy Tags: insurance, investing, investments, life insurance, money, pensions, retirement, stock action, stock market, stock trading, stock trading tips, stocks, tony robbins, trading, trading tips, wall street
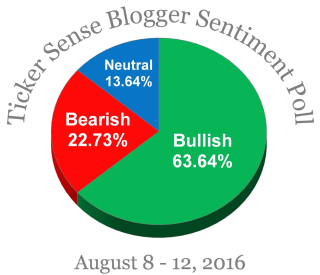
 This unique sentiment indicator shows that the stock market is grossly over-loved at this time by blogger/stock market advisors. That means, an investor/trader should be very careful if they’re betting on the long side now. With market history as an indicator and the tendency of sentiment gauges being contrary indicators, the bullish party may be over soon. My experience with this indicator is that it tends to have about a one-to-two week lead time before the market reacts. In the present case, the market should top out in a week or two according to this indicator.
Categories: Blogger Sentiment Tags: insurance, investing, investments, life insurance, money, pensions, retirement, stock action, stock market, stock trading, stock trading tips, stocks, tony robbins, trading, trading tips, wall street
STOCK MARKET STRATEGY FOR AUGUST 7, 2016: The stock market followed last week’s scenario and is now in a position to make new all-time highs. The internal market is not overbought so that any strength can continue for another week to 10 days without triggering much of an overbought signal. However, if new highs reveal widespread weakness in the general market, it would provide a good opportunity to move to the sidelines and wait for the next high-percentage set-up.
Key underlying short-term market indicators show the following:
***********
THE BOTTOM LINE: Last week I wrote the following: The stock market has been chewing up time and consolidating its gains from the Brexit lows. The internal indicators show that the general market is within reach of oversold readings. This presents an interesting situation where the price levels would appear to be too high, but the internal market shows that it’s getting set up for more upside. At the very least, I’d expect a retest of the previous highs and show us clues of either strength or weakness.
That has panned out pretty much as expected. But where do we go from here?
We are right near the area of the previous highs and new highs are certainly likely given the fact that a moderate oversold condition was achieved only 2 trading sessions ago. So timewise, the market can continue upwards for another week or two without become overbought. So resist the idea of going short and let the market show us whether the new highs are achieved with strength or weakness. Then you can determine if is a “bull trap” or not.
Categories: Stock Market Strategy Tags: nsions, retirement, stock action, stock market, stock trading, stock trading tips, stocks, tony robbins, trading, trading tips, wall street
STOCK MARKET STRATEGY FOR JULY 31, 2016: The stock market has been chewing up time and consolidating its gains from the Brexit lows. The internal indicators show that the general market is within reach of oversold readings. This presents an interesting situation where the price levels would appear to be too high, but the internal market shows that it’s getting set up for more upside. At the very least, I’d expect a retest of the previous highs and show us clues of either strength or weakness. Until then, the market can go in either direction with equal probabilities.
Key underlying short-term market indicators show the following:
***********
THE BOTTOM LINE: The stock market is in a position to go in either direction. A good case can be made for each. I’d expect another quick test of the previous highs with the anticipation of weakness on that retest. This would set up a correction in mid-to-late August that most traders would want to avoid holding long positions. But at this time, there doesn’t appear to be good high-probability trading opportunities for either long or short major market indexed positions.
Categories: Stock Market Strategy Tags: insurance, investing, investments, life insurance, money, pensions, retirement, stock action, stock market, stock trading, stock trading tips, stocks, tony robbins, trading, trading tips, wall street
STOCK MARKET STRATEGY FOR JULY 23, 2016: The stock market continues to push higher making new consecutive closing highs. The Dow ended up with 7 new highs in a row before backing off the last two days. A new closing high may signal the point of exhaustion if it is not confirmed by strength in other major indices. From there, we could start the decline to correct the advance from the February lows. This means that further strength should be sold into while buying needs to wait for the next oversold condition.
Key underlying short-term market indicators show the following:
***********
THE BOTTOM LINE: The stock market appears to be near the point of exhaustion, but not in a way that a prudent trader would want to short. The most likely scenario is for the markets to chew up time by backing and filling in terms of price action. That type of market behavior would frustrate most traders and investors. So while we may not go up much from here, it doesn’t mean that we’re headed straight down either. I would advise stepping aside and waiting for the market to set itself up for the next big move in whichever direction it chooses.
Categories: Stock Market Strategy Tags: insurance, investing, investments, life insurance, money, pensions, retirement, stock action, stock market, stock trading, stock trading tips, stocks, tony robbins, trading, trading tips, wall street
STOCK MARKET STRATEGY FOR JULY 17, 2016: The stock market has made 4 consecutive new closing highs in the Dow Jones Industrial Average. This leg of the rally is near the point of exhaustion meaning that a dip or correction is likely to occur soon. With the majority of indicators in neutral positions, the general market can still go in either direction. But it would be smarter to wait in order to take on new positions. The momentum is clearly on the bullish side so buying the dips is the optimal trading strategy.
Key underlying short-term market indicators show the following:
***********
THE BOTTOM LINE: The stock market washed out all the pessimism on the Brexit panic which left the market with only one way to go and that was up. If that Brexit bottom was in fact a cyclical low, the market from a time perspective has a lot more time to advance. The next similar bottom is most likely several weeks away. While it may be tough to buy here, it would be smart to wait for a dip and add new positions then. Otherwise, you can wait for a better bottom in the fall even if that should occur at higher prices.
Categories: Stock Market Strategy Tags: insurance, investing, investments, life insurance, money, pensions, retirement, stock action, stock market, stock trading, stock trading tips, stocks, tony robbins, trading, trading tips, wall street
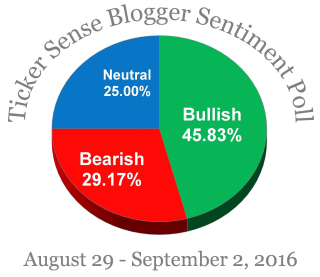 This sentiment indicator shows Bullish Sentiment at 45.83% and Non-Bullish Sentiment (Bearish + Neutral) at 54.17%. With this largely even spread between the bullish and non-bullish market stances among stock market bloggers, the general market can be deemed as “neutral” overall. That means that the market can go in either direction without bias. (Source: Ticker Sense)