STOCK MARKET STRATEGY FOR DECEMBER 26, 2016: The stock market is still hovering near its all-time highs with one more closing high in the Dow Jones Industrial Average likely in the coming week to 10 days. But keep in mind that this time of the year can be very tricky and volatile. I see this week as the set up for the first week of the year which may be the final high for the intermediate term. Or we could decline into next week setting up a bottom during the first week of January with a rally into March. Be prepared for either kind of scenario.
Key underlying short-term market indicators show the following:
***********
THE BOTTOM LINE: The Fear/Greed Index is currently reading “Greed” which still makes me think that we have one more rally and revisit into the “Extreme Greed” area. With the internal breadth indicator reading “neutral,” I believe that this will be a week of non-action. On the other hand, anticipate the first week of the year to be eventful and possibly a short-term scare or longer term non-confirmation intermediate top. Either could happen in about 7-10 days.
Categories: Stock Market Strategy Tags: insurance, investing, investments, money, retirement, stock market, stock market timing, stock trading, stocks, tony robbins, trading, wall street
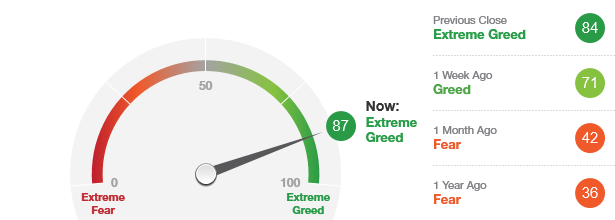
 Today’s “Fear/Greed Sentiment Index” reading has moved from “Extreme Greed” to “Greed” as of this week. Any return to new highs by the Major Indices will most likely move the needle back into the “Extreme Greed” territory. However, this second return to “Extreme Greed” territory will most likely signal the final rally of this move. Expect the first weeks of January to be tricky and counter-intuitive.
Categories: Fear & Greed Index Tags: insurance, investing, investments, money, QQQ, retirement, SPY, stock action, stock market, stocks, tony robbins, trading, wall street
STOCK MARKET STRATEGY FOR DECEMBER 18, 2016: The stock market continues to hover near its all-time highs in the majority of indexes. With the internal breadth indicators nearing “oversold” readings, it looks like a brief decline of maybe one or two trading sessions will lead to another run to new highs and beyond. While most of the buying power has been spent on this present rally, a quick trade to the upside may be worth a bet until the end of the year.
Key underlying short-term market indicators show the following:
***********
THE BOTTOM LINE: The Fear/Greed Index is currently reading “Extreme Greed” and means that this is more a time to sell than to buy. But with the internal breadth indicators nearing “oversold,” it looks we will get our “Santa Claus Rally” right on cue for a ride up until New Years Eve. But after that, the reality of an overbought, over-valued, and over-loved market will bring the correction or even an end to the intermediate-term rally since the Election.
Categories: Stock Market Strategy Tags: insurance, investing, investments, money, retirement, stock market, stock market timing, stock trading, stocks, tony robbins, trading, wall street
 Last week’s stock market strategy report said that the general market was surprisingly “oversold” and ready for an extension of the post-election rally. We certainly got that rally and more with the “Fear/Greed Sentiment Index” pushing into the “Extreme Greed” range for all 5 days. I would still expect a few days with readings over 90 before this rally has exhausted itself. But this is still no place to be going long and only the pros should consider heavy betting on the downside. If you’re inclined to trade, this may be a time to step aside and let the market zig-zag higher with non-confirmations or zig-zag lower into another short-term oversold condition. Either of these scenarios appears to be more than a week away. So stay on the sidelines and let the market set itself up for the next trading opportunity.
Categories: Fear & Greed Index Tags: insurance, investing, investments, money, QQQ, retirement, SPY, stock action, stock market, stocks, tony robbins, trading, wall street
STOCK MARKET STRATEGY FOR DECEMBER 4, 2016: The stock market has been correcting its move from the election lows over the past several days. With the majority of internal breadth indicators at “oversold” readings, a short-term rally should begin now. This final rally should mark the end of the big move from February’s low. Look for this rally to be lead by the oil stocks and unconfirmed by the leading technology stocks which typically signals the end of a major move.
Key underlying short-term market indicators show the following:
***********
THE BOTTOM LINE: The Fear/Greed Index is currently reading “Greed” after a short stint in the “Extreme Greed” territory. If we get a rally from right here, the new readings should mostly be in the “Extreme Greed” area and signal a time to get out of the market for the intermediate term. Expect a decline after this next rally to last two to three months and probably retract all of the “Trump Rally” and possibly more. But for now, look for one more short-term rally with several non-confirmations to finish this major move from the February lows.
Categories: Stock Market Strategy Tags: insurance, investing, investments, money, QQQ, retirement, SPY, stock action, stock market, stocks, tony robbins, trading, wall street
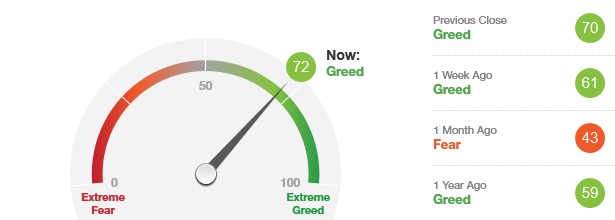 This indicator is labeled as being in the “Greed” zone right now. Ideal buying opportunities have only occurred when the general market has been in the “Extreme Fear” zone. Conversely, optimal selling opportunities tend to occur when the general market has been in the “Extreme Greed” zone. This suggests that the market needs a little more time in order to generate greater greed in order to sell. So don’t be surprised if the market continues to zig-zag its way to higher highs. With the strength of this move, the market can stay in the “Extreme Greed” area for over a week as well.
Categories: Fear & Greed Index Tags: investing, investments, money, QQQ, retirement, SPY, stock action, stock market, stock trading, stocks, tony robbins, trading, wall street
STOCK MARKET STRATEGY FOR OCTOBER 29, 2016: From a breadth perspective, the stock market is in an oversold condition right now. But it is days to a week or so away from reaching a similar level on a sentiment basis. With the big news on the political front Friday, that sentiment could change quickly to get in line with the breadth indicators causing a bottom to form around Election Day November 7-9. Be ready to buy long on a panic low forming around that time.
Key underlying short-term market indicators show the following:
***********
THE BOTTOM LINE: The sentiment indicators such as the Fear/Greed Index and the Blogger Sentiment Poll are in neutral positions. Before a sustained move in either direction, we need these indicators to go to an extreme. But the internal breadth indicators are now at oversold readings. This means that the breadth of the market has been extremely negative and is one of the key prerequisites to a bottom formation. That bottom looks like it is forming just in time for Election Day. Caution: It will be tricky and hard to catch at the exact bottom. Being a day or two early or late could cost you lots of money so be nimble and ready to buy incrementally into the panic. It will most likely be a V-shaped bottom.
Categories: Stock Market Strategy Tags: investing, investments, money, QQQ, retirement, SPY, stock action, stock market, stocks, tony robbins, trading, wall street
STOCK MARKET STRATEGY FOR OCTOBER 22, 2016: The stock market is in a neutral trading range as it sets itself up for a possible big move around Election Day. The internal breadth indicators are trending up suggesting that a minor short-term top could occur during the coming week. Then we could have a final drop into a low about November 7-9. Now would be a good time to get yourself ready to participate in a year-end rally of significance. But first, beware of news that will trick the public into selling right at the turning point…alas the Brexit vote.
Key underlying short-term market indicators show the following:
***********
THE BOTTOM LINE: The internal breadth and sentiment indicators such as the Fear/Greed Index and the Blogger Sentiment Poll are in neutral positions. Before a sustained move in either direction, we need these indicators to go to an extreme. That takes time which means that nothing of significance will occur in the general market for a few weeks.
Categories: Stock Market Strategy Tags: investing, investments, money, QQQ, retirement, SPY, stock action, stock market, stock trading, stocks, tony robbins, trading, wall street
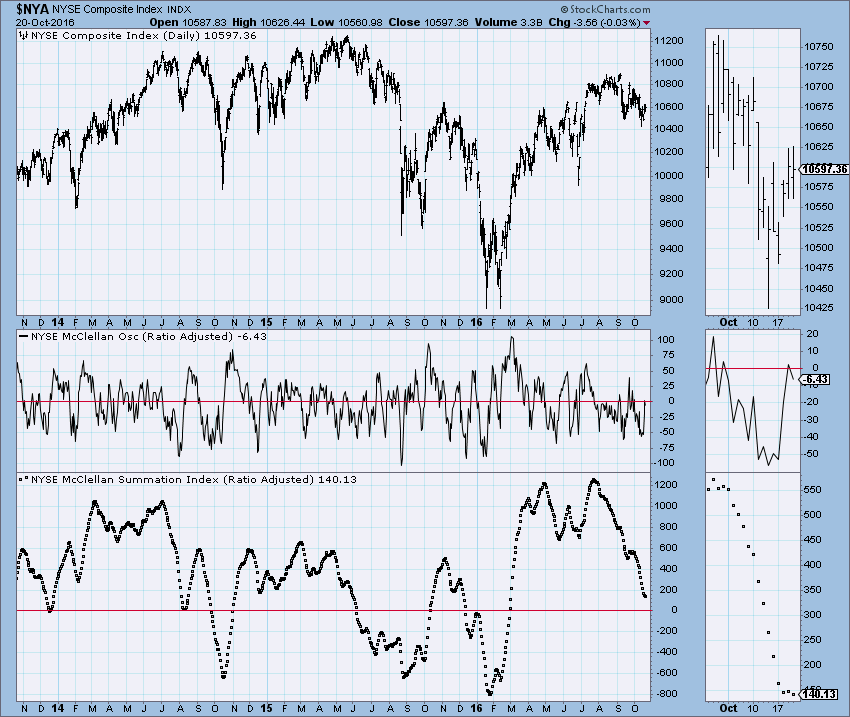
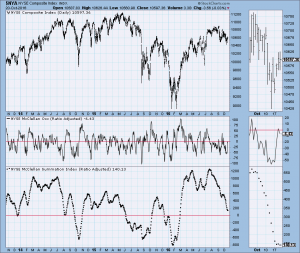 Looking at the bottom chart of the Summation Index, I’d be very careful about trying to catch the bottom of this move. It looks like a giant head-and-shoulder top to me. That means a lot more time devoted to the downside and a reading of -400 minimum. After it crosses the -400 reading, you have about a 1-2 weeks lead-time before the final bottom is reached. And as we all know, the exact bottom is usually very tricky to catch….better to scale-in on the final leg down.
Categories: Stock Market Strategy Tags: investing, investments, money, QQQ, retirement, SPY, stock action, stock market, stock trading, stocks, tony robbins, trading, wall street