STOCK MARKET STRATEGY FOR JULY 4, 2016: The stock market was an amazing roller coaster ride is past week. In the end, the internal indicators that I follow most closely are all a few days away from becoming overbought. This means that there is a little more room to the upside (100-300 DJIA points), but most likely it’s too late to buy. Instead, use near-term market strength to lighten up positions with a likelihood of a better low-risk entry point later in the summer or early fall.
Key underlying short-term market indicators show the following:
***********
THE BOTTOM LINE: The stock market proved to be a tricky place to be last week after two straight down days were followed by 4 straight up days. With this kind of volatility, you certainly don’t want to be on the wrong side of a trade. Right now, we are not anywhere close to an entry point so one should hold their positions and look to sell overbought/overvalued positions. It will take some time in order to set up for another buying opportunity. For most swing traders, this is a time to sit out.
Note: Previous closing highs for the Dow Jones Industrial Average were 18312 in May 2015 and 18096 in April of this year. A final closing DJIA between those marks should probably mark the end of this rally from the February 2016 lows.
Categories: Stock Market Strategy Tags: insurance, investing, investments, life insurance, money, pensions, retirement, stock action, stock market, stock trading, stock trading tips, stocks, tony robbins, trading, trading tips, wall street
STOCK MARKET STRATEGY FOR JUNE 27, 2016: The stock market had a sharp rally on Thursday followed by an even sharper decline on Friday. This left the internal indicators with neutral readings trending down. This means that the decline has more to go on the downside with a bounce expected soon. But overall, the market is more likely to decline for some more time in order to create the necessary shift in sentiment that is critical to forming an intermediate term bottom opportunity. But for now, anticipate central bank manipulation to create a wild ride on Wall Street.
Key underlying short-term market indicators show the following:
***********
THE BOTTOM LINE: The stock market needs some more time in order to reach an oversold tradeable bottom. The soonest that could happen would be the week following the 4th of July holiday. Until then, it may be smarter to detach yourself from this market as a period of wild moves can be expected this coming week as Central Banks try to instill confidence in an unstable global market. I’d guess the July 11th plus or minus one day is about the time market rallies again. This rally could be sharp, tricky to catch, but highly profitable for those who can bet wisely.
Categories: Stock Market Strategy Tags: insurance, investing, investments, life insurance, money, pensions, retirement, stock action, stock market, stock trading, stock trading tips, stocks, tony robbins, trading, trading tips, wall street
STOCK MARKET STRATEGY FOR JUNE 20, 2016: The stock market has reached oversold conditions in all of the internal indicators that are followed here. But be careful about committing too much to the long side at this time. Expect lots of volatility in the coming week with the news coming out of Britain. I would expect false moves in either direction with the end result being the formation of an overall topping formation. But for the nimble, a little more weakness could lead to another trip to challenge the previous highs.
Key underlying short-term market indicators show the following:
***********
THE BOTTOM LINE: The stock market may produce a short-term bounce or a period of volatile up and down action. Expect the political news from Britain to provide the backdrop to some wild action over the next two weeks. As a trading strategy, I may go long on a move to the 200-day moving average of any of the major indices. It would only be as a short-term trade to play the bounce.
Categories: Stock Market Strategy Tags: insurance, investing, investments, life insurance, money, pensions, retirement, stock action, stock market, stock trading, stock trading tips, stocks, tony robbins, trading, trading tips, wall street
STOCK MARKET STRATEGY FOR JUNE 5, 2016: The stock market hit its high for this rally since February on Wednesday just above the 18,000 mark of the DJIA. With the internal indicators all trending down, the major averages might reach an oversold conditions this coming week and produce a bounce. This bounce will tell whether there is enough strength to continue the rally or begin a longer, intermediate-term decline of significance. In any case, be prepared for scary volatility in both direction for the rest of this month.
Key underlying short-term market indicators show the following:
***********
THE BOTTOM LINE: The stock market may have reached the end of this rally since February 11th this past Wednesday. As such, treat any bounces as chances to lighten up or get out of the market. We could get oversold reading this week which would produce a retest bounce. That bounce may be a wise time to take the money and run. This may be a significant intermediate change in the market’s direction.
Categories: Stock Market Strategy Tags: insurance, investing, investments, life insurance, money, pensions, retirement, stock action, stock market, stock trading, stock trading tips, stocks, tony robbins, trading, trading tips, wall street
STOCK MARKET STRATEGY FOR JUNE 5, 2016: The stock market is coming off of an overbought condition with a decent chance of a buying opportunity soon. The internal indicators are trending down and with some more weakness could reach oversold conditions by the end of the week. So a time to buy into this market with good odds is possible if the market corrects some more. Otherwise, a move to challenge the old highs would more than likely run out of gas.
Key underlying short-term market indicators show the following:
***********
THE BOTTOM LINE: The stock market could present a buying opportunity in the next week to 10 days if a correction were to continue. So be ready, keep your powder dry, and wait for a possible chance to ride the market up to new highs and beyond.
Categories: Stock Market Strategy Tags: insurance, investing, investments, life insurance, money, pensions, retirement, stock action, stock market, stock trading, stock trading tips, stocks, tony robbins, trading, trading tips, wall street
STOCK MARKET STRATEGY FOR MAY 28, 2016: The stock market recovered 3 weeks worth of correction in just 2 days! But now it is reaching overbought levels which puts a lid on further advances for the time being. But after a short, mild, or sideways correction, a move to new highs is very possible. Perhaps it has more to do with time than price. By that I mean, that the market needs a week to correct its move and it doesn’t matter how many points it goes down. What matters is that a buying opportunity is likely during the second week of June and it would be wise to prepare for it.
Key underlying short-term market indicators show the following:
***********
THE BOTTOM LINE: The stock market needs a breather. The upside is limited from here as the internal indicators are near or at overbought levels. But after some time spent going down or sideways, there might be a good entry point to ride this market to new highs. Be prepared for a buying opportunity during the second week of June.
Categories: Stock Market Strategy Tags: insurance, investing, investments, life insurance, money, pension plan, QQQ, retirement, SPY, stock action, stock market, stock trading, stock trading tips, stocks, tony robbins, trading, trading tips, wall street
STOCK MARKET STRATEGY FOR MAY 22, 2016: The stock market bounced off of trendline and moving average support levels intraday on Thursday. This was from semi-oversold levels and could be the marking of a bottom. If so, I’d be looking for a zig-zag down in the coming week to provide another entry point for a short-term trade. But otherwise, a major intermediate bottom would require more prolonged emotional pain in the minds of investors and that doesn’t appear to be the case now.
Key underlying short-term market indicators show the following:
***********
THE BOTTOM LINE: The stock market may provide an entry point this week for a short-term trade. But a more sustained bottom will require more pain in terms of lower prices. That won’t happen until June at the very earliest. With the internal indicators in neutral positions, the market can go in either directions with the same probability. Stay on the sidelines for now.
Categories: Stock Market Strategy Tags: insurance, investing, investments, life insurance, money, QQQ, retirement, SPY, stock action, stock market, stock trading, stock trading tips, stocks, tony robbins, trading, trading tips, wall street
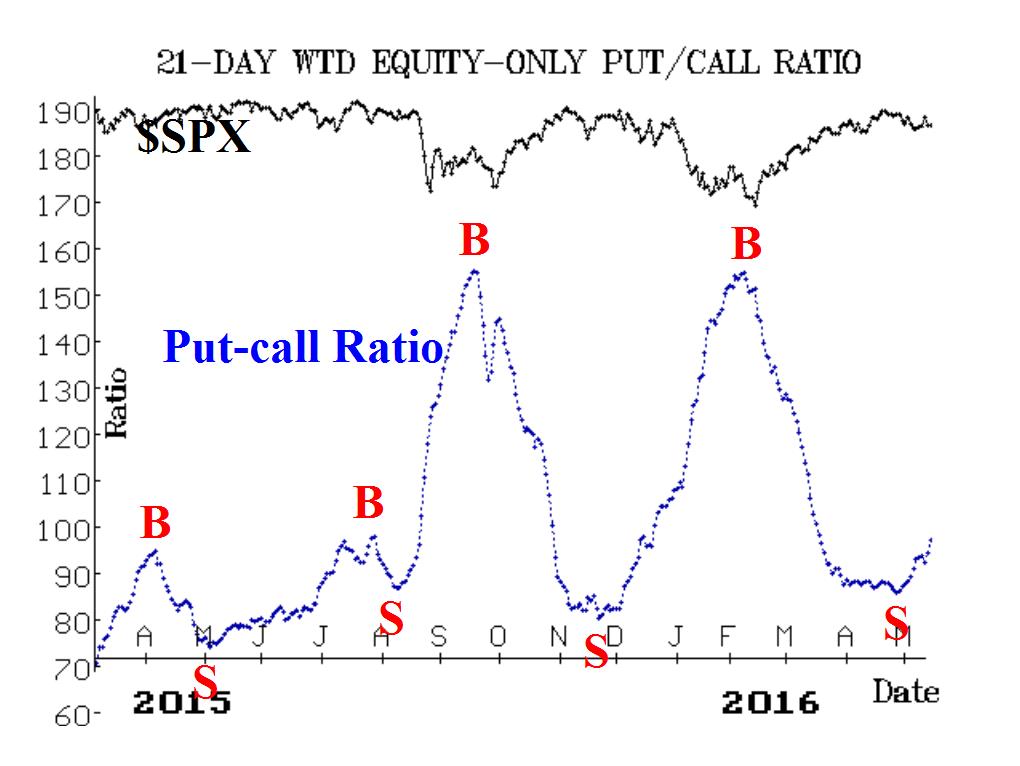
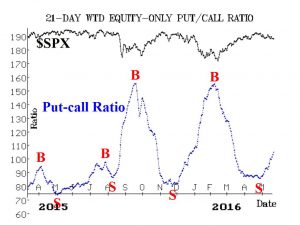 The tide has turned according to this venerable intermediate-term indicator. And while short-term bounces can occur whenever the market gets slightly oversold, this chart shows us that the really good buying opportunities occur when the red “B” is closer to the 150 level on the left axis. This level does not appear to be possible for at least another month of market activity. The general pessimism in the market is not yet at the level of fear that is needed in order to buy for the longer term. (Source: www.optionstrategist.com)
Categories: Put/Call Ratio Timing Indicator Tags: 401k, annuities, insurance, investing, investing tips, investments, life insurance, money, pension plan, QQQ, retirement, SPY, stock action, stock market, stock trading, stock trading tips, stocks, tony robbins, trading, trading tips, wall street
STOCK MARKET STRATEGY FOR MAY 15, 2016: The stock market bounced from an oversold condition mid-week and then reversed to the downside by Friday. With the internal indicators reset to neutral positions, the market can experience moves in either direction. This sets up a volatile market and one that is likely to have some scary moments to the downside. While a retest of previous highs in still a possibility, I would stay out until a better bottom appears as a result of higher investor fear in the market.
Key underlying short-term market indicators show the following:
***********
THE BOTTOM LINE: The stock market could go in either direction. My guess is that the market needs more fear in order to sustain a rally worth betting on. So expect bad news and increased volatility in the near term in order to create the ideal buying situation.
Categories: Stock Market Strategy Tags: 401k, insurance, investing, investing tips, investments, life insurance, money, pension plan, QQQ, retirement, SPY, stock action, stock market, stock trading, stock trading tips, stocks, tony robbins, trading, trading tips, wall street
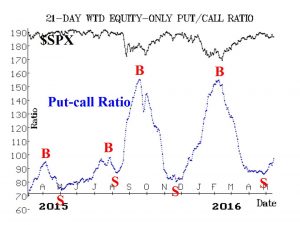 This intermediate-term indicator shows that the rally from February 11th is over. The next destination is a buy signal marked by the red “B” which should ideally arrive when the x-axis is above 150. In terms of time, that would project to the July time period if you were to measure the space between the two most recent buy signals. Based on this, it would be prudent to sit out the action in the stock market until more severe pain causes a better buying opportunity. With the goal of buying low and selling high, it is not a time to buy now. (Source: www.optionstrategist.com)
Categories: Put/Call Ratio Timing Indicator Tags: 401k, annuities, insurance, investing, investing tips, investments, life insurance, money, pension plan, QQQ, retirement, SPY, stock action, stock market, stock trading, stock trading tips, stocks, tony robbins, trading, trading tips, wall street