 STOCK MARKET STRATEGY FOR APRIL 23, 2017: The stock market remains in a neutral position with the ability to go in either direction. The last two weeks has presented the market with an opportunity to become “oversold” but rallied modestly instead to prevent investors and traders from getting to a low-risk entry point. Expect the market to set itself up for the next trading opportunity in the coming weeks, but right now it’s best to take a wait and see approach to this tricky news-driven market.
Key underlying short-term market indicators show the following:
***********
THE BOTTOM LINE: The Fear/Greed Index is currently reading “Fear” after being in the “Extreme Fear” range for only one trading day. I would expect a much deeper reading in the “Extreme Fear” range in order to safely say that the stock market is “oversold” or “under-loved” in terms of sentiment. The current geopolitical climate should serve to push sentiment strongly in one direction or the other. And most likely, it will create the desire emotion of “extreme fear” which allows presents disciplined traders with a low-risk buying opportunity. So right now it’s best to let the market set itself up for the next trading opportunity.
Categories: Stock Market Strategy Tags: insurance, investing, investments, money, retirement, stock market, stock market timing, stock trading, stocks, tony robbins, trading, wall street
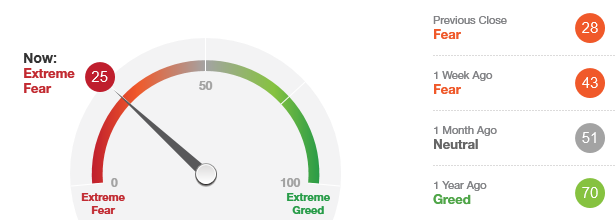 The “Fear/Greed Sentiment Index: What Emotion is Driving the Market Now?” reading has finally moved into the “Extreme Fear” range this past week. But it is just touching that area and I would expect a reading under 20 in order to feel like it is truly registering “Extreme Fear.”
But this indicator is now saying that it’s time to start thinking about accumulating pilot positions for the next rally. The challenge is that there hasn’t been much price erosion in the market since its March top. Hence, many positions are still well over their 200-day moving averages with plenty more room to correct.
I’d look at this indicator as simply a sign to start thinking about going long the general market and use other breadth indicators to fine-tune the timing. And many of the breadth indicator are starting to flash buy alerts as well. So a bottom is close at hand unless we rally quickly to lessen the downward pressure.
Categories: Fear & Greed Index Tags: insurance, investing, investments, money, retirement, stock market, stock market timing, stock trading, stocks, tony robbins, trading, wall street
STOCK MARKET STRATEGY FOR APRIL 8, 2017: The stock market remains in neutral territory despite the unstable news background. But the news will help create the cover story for the next top or bottom as it will polarize public sentiment. Right now it appears that the breadth oscillators are heading down towards an oversold bottom in the near term (3 to 5 days). If the readings become low enough, a rally worth trading to the upside may be in store for us. But until those low reading occur, it’s probably wisest to keep your powder dry for better odds in playing this tricky market.
Key underlying short-term market indicators show the following:
***********
THE BOTTOM LINE: The Fear/Greed Index is currently reading “Fear” after being in the “Neutral” area for a week. The set-up in the breadth oscillators suggests that a short-term bottom is nearby. If the Fear/Greed Sentiment Index can register an “Extreme Fear” reading in the meantime, we may have a sharp rally to ride into May. But until that sets up properly, it’s best to do nothing except get your ducks in a row.
Categories: Stock Market Strategy Tags: insurance, investing, investments, money, retirement, stock market, stock market timing, stock trading, stocks, tony robbins, trading, wall street
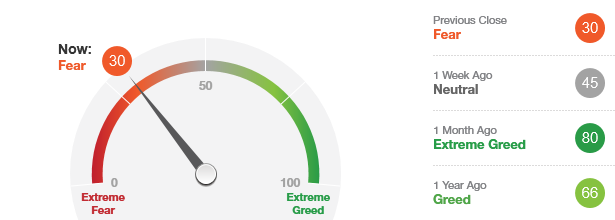 The “Fear/Greed Sentiment Index: What Emotion is Driving the Market Now?” reading has moved into the “Fear” range this past week. When it reaches the “Extreme Fear” area, it will become one of the pre-conditions for an intermediate-term stock market bottom.
So any further weakness in the general market will probably put this index in the “Extreme Fear” range which means that it’s a time to start getting your feet wet with a diversified long position. My favorite plays would be the SPY and QQQ Exchange-Trade Funds.
But since the last market top was not very far from the current position, I’d look at this next bottom as being only a starting point to challenge the old highs.
Categories: Stock Market Strategy Tags: insurance, investing, investments, money, retirement, stock market, stock market timing, stock trading, stocks, tony robbins, trading, wall street
STOCK MARKET STRATEGY FOR MARCH 19, 2017: The stock market is currently continuing its “bounce” off of a short-term oversold condition. This bounce has not been very strong and is approaching the “overbought” range. This suggests that the buying is not very strong and another round of declines will resume shortly. A better buying opportunity will likely present itself in the future, but when that will be depends on how oversold the market can become. In my opinion, this is a good time to be out of the market.
Key underlying short-term market indicators show the following:
***********
THE BOTTOM LINE: The Fear/Greed Index is currently reading “Neutral” after being in the “Greed” and “Extreme Greed” for several weeks. If it can continue to weaken into the “Extreme Fear” range, we could be in store for a good intermediate term bottom in which to buy into. But right now, it’s still anyone’s guess which direction we go and for how long. But at least, we are getting a correction from the rally that left most investors behind.
Categories: Stock Market Strategy Tags: insurance, investing, investments, money, retirement, stock market, stock market timing, stock trading, stocks, tony robbins, trading, wall street
STOCK MARKET STRATEGY FOR MARCH 5, 2017: The stock market blasted to a new high on its new leg up after President Trump’s State of the Union address. The relentless rally continues with a possible pause next week followed by another quick rally to retest this week’s highs. What is surprising is how close the internal indicators are to being “oversold.” This could mean that a short-term buy signal is not far away and this seems to make almost no sense at all. I’d be looking at the Volatility Indicator for the best timing tool for this next bottom.
Key underlying short-term market indicators show the following:
***********
THE BOTTOM LINE: The Fear/Greed Index is currently reading “Greed” after being in the “Extreme Greed” for a few days last week. This doesn’t mean that the market is going to go down. It just suggests that you shouldn’t be buying at this time. This type of strong upside market is not one that you’d want to play the short side on. Instead, look for short-term oversold conditions to pop up that offer you a good chance to make some fast money with less risk. Don’t be too surprised if this market continues to climb the proverbial “wall of worry.”
Categories: Stock Market Strategy Tags: insurance, investing, investments, money, retirement, stock market, stock market timing, stock trading, stocks, tony robbins, trading, wall street
STOCK MARKET STRATEGY FOR FEBRUARY 26, 2017: The stock market continued its relentless advance last week with its 1th straight closing high. Normally, this would qualify as an upside blow-off with only one remaining piece to the puzzle: a large one-day reversal to the downside usually triggered by an obvious piece of good news. That reversal would mark the internal high of the market and would likely be followed in 5 to 7 days by a final weaker retest.
Key underlying short-term market indicators show the following:
***********
THE BOTTOM LINE: The Fear/Greed Index is currently reading “Greed” after being in the “Extreme Greed” area for most of last week. The internal indicators are surprisingly close to “oversold” readings which would appear to make no sense at all. Because of the mixed signals and the 11 consecutive new closing highs, it might be smarter to step aside and watch the fireworks. This strategy would be wiser rather than trying to play the genius by betting large sums of your after-tax capital on risky bets.
Categories: Stock Market Strategy Tags: insurance, investing, investments, money, retirement, stock market, stock market timing, stock trading, stocks, tony robbins, trading, wall street
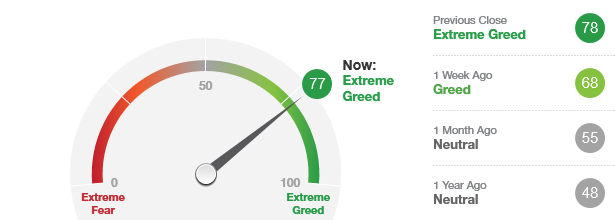 The “Fear/Greed Sentiment Index: What Emotion is Driving the Market Now?” reading has moved back into the “Extreme Greed” range this past week. This is one of the pre-conditions for an intermediate stock market top. The prudent thing to do would be to lightened up on any over-extended long positions on further strength in the market. There will be another time later on when stocks will be of greater value than is present right now. Remember that tops take longer time to form than bottoms, so you don’t have to sell right this minute. The main thing is to know that this is a golden opportunity to get a very good price for any stocks that you’ve purchased at lower prices. You can always buy back in at lower prices later on – “The Wall Street Casino will always be open.”
Note: I consider an “Extreme Greed” reading as over 80. This reading may occur several times in a “sell” area. In the present epic rally, I’d even expect readings closer to 95-100 before an actual downturn ensues.
Categories: Fear & Greed Index Tags: insurance, investing, investments, money, retirement, stock market, stock market timing, stock trading, stocks, tony robbins, trading, wall street
STOCK MARKET STRATEGY FOR FEBRUARY 12, 2017: The stock market continues to push higher without the slightest correction. The news background continues to be of relentless optimism in terms of the outlook for business and the economy. This public sentiment should equate to a market intermediate top in the not-to-distant future. The internal indicators are trending up towards the “overbought” region with a decent possibility of a top coming in the next week or two. If your strategy is to buy low and sell high, then we are probably already in that “sell high” area now.
Key underlying short-term market indicators show the following:
***********
THE BOTTOM LINE: The Fear/Greed Index is currently reading “Greed” which allows for more room to the upside. Once is reaches the “Extreme Greed” area, it would be prudent to start taking some more chips off of the table. The stock market casino is always open so missing some profits is a smart strategy overall when the risks of losing money are far greater. The odds of the stock market game strongly favor lightening up as we enter the area of “Extreme Greed.”
Categories: Stock Market Strategy Tags: insurance, investing, investments, money, retirement, stock market, stock market timing, stock trading, stocks, tony robbins, trading, wall street
STOCK MARKET STRATEGY FOR JANUARY 29, 2017: Last week, the stock market advanced with another leg up in the Trump Rally. The internal breadth indicators are still in very “neutral” territory suggesting that there is more room to run on the upside. However, the “Volatility Indicator” is in the “overbought” area and puts a cap on how long the rally can continue. So I’d be looking for another rally in the short-term, but with a bigger chance of a correction in February to cool the jets of euphoric traders.
Key underlying short-term market indicators show the following:
***********
THE BOTTOM LINE: The Fear/Greed Index is currently reading “Greed” which means that it still has lots more room to the upside before it reaches “Extreme Greed” territory. The market looks like it will continue to climb the proverbial “wall of worry” as it refuses to correct and offer an “oversold” reading in the 4 breadth oscillators that are shown above. If the market were to correct or stall, then any “oversold” readings would be a time to “buy the dip” in a broad-based ETF for a continuing ride up.
Categories: Stock Market Strategy Tags: insurance, investing, investments, money, retirement, stock market, stock market timing, stock trading, stocks, tony robbins, trading, wall street