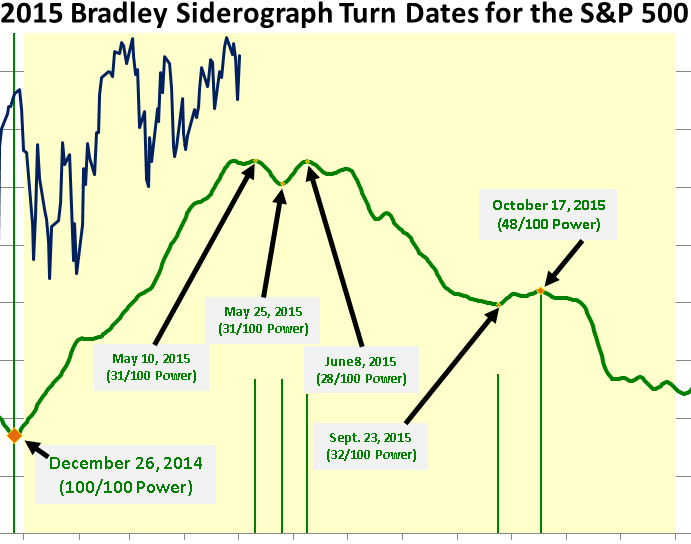
STOCK MARKET OBSERVATIONS FOR May 25, 2015: The stock market remains within striking distance of its all-time highs. The recent period of consolidation and decline has moved breadth indicators closer to “oversold” readings. In fact, the daily TRIN readings have been on the “sell” side for 12 out of the last 13 trading sessions. This sets up a possible buying opportunity in the near term if the market can continue its decline for the next 5-7 trading sessions. Look for “obvious bad news” to provide the necessary cover for entering the market to go long.
Key underlying market indicators show the following:
***********
ADVICE TO TRADERS AND INVESTORS: If the market continues its decline in the next week to 10 days, we could be presented with a short-term buying opportunity. Since this could result in another “V-Shaped Bottom,” you’ll need to have some positions in place before the tide turns. This means that you’ll need to divide up your capital and wade into the market waters in gradual increments while trying to catch the proverbial “falling knife.”
Your best vehicles will probably be broad-based Exchange-Trade Funds such as the SPY, DIA, and QQQ. For more speculative accounts, the SSO and QLD may provide extra leverage for the initial thrust out of the oversold condition. But be careful here, stay nimble, and don’t get too greedy. The next rally from here may only turn out to be a consolidation period before a 2nd nasty leg down starts.
Categories: Stock Market Strategy Tags: AAPL, ETF, invest, investing, investing tips, investments, money, money mastery, QQQ, SPY, stock action, stock market, stock trading, stock trading tips, stocks, tony robbins, trading, trading tips, wall street
STOCK MARKET OBSERVATIONS FOR May 25, 2015: The stock market remains at the top of its trading range as it is working off its “overbought” condition. Internal breadth indicators now have “neutral” readings which suggests that the market can go in either direction. But an ideal buying opportunity is not present until the majority of indicators show “oversold” readings. So while the market can go in either direction, I would expect a slight move downwards before the market breaks out to the upside.
Key underlying market indicators show the following:
***********
ADVICE TO TRADERS AND INVESTORS: Don’t be surprised if the market decides to breakthrough resistance and go on to new highs. The stall at the top of the trading range is allowing the internal market to balance out. Unfortunately, there isn’t a pivot point in which to buy the market unless we get a little more scare to the downside. If and when the market does break to the upside, it will climb the proverbial “wall of worry.”
Categories: Stock Market Strategy Tags: AAPL, ETF, invest, investing, investing tips, investments, money, money mastery, QQQ, SPY, stock action, stock market, stock trading, stock trading tips, stocks, tony robbins, trading, trading tips, wall street
STOCK MARKET OBSERVATIONS FOR May 17, 2015: The stock market is at the top of its trading range. The next closing high (or two) in the Dow Jones Industrial Average may turn out to be the last one for the intermediate term. A day or two more to the upside should push all of the breadth indicators to “overbought” levels. That would put a lid on any significant movement in the current rally and strongly favors a sizable correction in the coming 3 to 5 weeks.
Key underlying market indicators show the following:
***********
ADVICE TO TRADERS AND INVESTORS: If the market back off right here and consolidates, then there is a good chance for a clean breakout to the upside. On the other hand, a quick small move to the upside would probably result in an unconfirmed intermediate term top in the market. This would be a good time to sell into any rally in the next two trading days or even take a small speculative position in a weaker broad-market short instrument like TZA.
Categories: Stock Market Strategy Tags: AAPL, ETF, invest, investing, investing tips, investments, money, money mastery, QQQ, SPY, stock action, stock market, stock trading, stock trading tips, stocks, tony robbins, trading, trading tips, wall street
STOCK MARKET OBSERVATIONS FOR May 10, 2015: The stock market rallied on Friday into its projected Bradley Turn Date for May 10th. Whether this pans out or not will be quite interesting as the market’s pattern unfolds in the coming weeks. On the technical side, internal breadth indicators are now in “neutral” positions with last week’s volatility. This means that the market is in the position of going in either direction with equal probabilities. So until there is a clear breakout, the market remains in the tight trading range that’s been in place for the entire year.
Key underlying market indicators show the following:
***********
ADVICE TO TRADERS AND INVESTORS: The only clearly oversold Exchange-Traded Funds as far as the Money Flow Indicator is concerned is the TLT (Barclay’s 20+ year U.S. Treasury Bond Fund) and the PGF (PowerShares Financial Preferred Stock Fund). This seems counter-intuitive based on the popular perception that interest rates will be rising shortly. Otherwise, this again appears to be a time to stay on the sidelines and away from the risk of this indecisive general market.
Categories: Stock Market Strategy Tags: AAPL, ETF, invest, investing, investing tips, investments, money, money mastery, QQQ, SPY, stock action, stock market, stock trading, stock trading tips, stocks, tony robbins, trading, trading tips, wall street
STOCK MARKET OBSERVATIONS FOR May 3, 2015: The stock market dropped slightly this past week creating some semi-oversold breadth readings. But Friday’s “gap up” rally, has put the market back in the mid-range of the internal oscillators. A smart trader/investor should be ready for another retest of the highs in the coming week. And while the Dow Jones Industrial Average may achieve a new closing high, the chances are good that the market will not move much past that number. With the yield on the 10-year Treasury Note going higher, it is creating a slow shift from bullish to bearish in the underlying stock market.
Key underlying market indicators show the following:
***********
ADVICE TO TRADERS AND INVESTORS: This would be another time to stay out of the market or lighten up on positions as the old highs in the indices are challenged. On the other hand, if the market was to decline in the next several sessions, we could be presented with a short-term buying opportunity. The strategy that has been most effective over the 12 months is to “buy the dips, and sell the rips.”
Categories: Stock Market Strategy Tags: AAPL, ETF, invest, investing, investing tips, investments, money, money mastery, QQQ, SPY, stock action, stock market, stock trading, stock trading tips, stocks, tony robbins, trading, trading tips, wall street
STOCK MARKET OBSERVATIONS FOR April 26, 2015: The stock market is at the top of its trading range right now. While the Nasdaq and S&P 500 are reaching new highs, the Dow Jones Industrial Average and Dow Jones Transportation Average have yet to confirm. With all six of the internal breadth indicators listed below in neutral positions, the general market has room to go in either direction. This is a time to step back and let the market determine its own course. With the release of Apple’s earning on Monday, we could get our answer real soon.
Key underlying market indicators show the following:
***********
ADVICE TO TRADERS AND INVESTORS: There are no trades in sight except for possible accumulations of precious metals on further weakness in the coming weeks. While it may not be the final bottom for these issues, a policy of dollar-cost averaging may be a smart way to play the GDX, GLD, and/or SLV Exchange-Traded Funds. These ETFs are gradually approaching the lower end of their trading ranges where they should all find support. Of these issues, I prefer the GDX because it has the highest average daily volume and greatest volatility.
Categories: Stock Market Strategy Tags: AAPL, ETF, invest, investing, investing tips, investments, money, money mastery, QQQ, SPY, stock action, stock market, stock trading, stock trading tips, stocks, tony robbins, trading, trading tips, wall street
STOCK MARKET OBSERVATIONS FOR April 19, 2015: The stock market challenged the previous highs on Thursday before dropping into the end of Friday’s session. What looked like a breakout to the upside is now threatening to be just the opposite – a breakout to the downside. But most of the internal indicators are approaching oversold levels. These indicators tend to be a couple of days early so that a trading bottom appears to be more than a week away at best. This is a time in which a smart market player waits for a deeply oversold bottom before committing any funds.
Key underlying market indicators show the following:
***********
ADVICE TO TRADERS AND INVESTORS: Be ready for a short-term bounce on further weakness during Monday’s or Tuesday’s session. You can take small bets on the following leveraged broad-based ETFs for fast money: SSO, DDM, QLD.
Otherwise, it is best to wait for oversold readings in the Full Stochastics Indicators for the DIA, SPY, QQQ, and IWM Exchange-Traded Funds which are just now beginning their decent downwards.
Categories: Stock Market Strategy Tags: AAPL, ETF, invest, investing, investing tips, investments, money, money mastery, QQQ, SPY, stock action, stock market, stock trading, stock trading tips, stocks, tony robbins, trading, trading tips, wall street
STOCK MARKET OBSERVATIONS FOR April 5, 2015: The stock market climbed and dropped last week putting all of the internal breadth indicators in neutral positions. With the negative jobs reports on Friday, expect the stock market to begin the week with an initial sharp downward move. But don’t be surprised if this spike down is completed by late Wednesday and the start of another “V-Shaped” bottom takes shape. This has been the pattern over the last several months as the hedge funds, computer trading, and institutions compete for performance.
Key underlying market indicators show the following:
***********
ADVICE TO TRADERS AND INVESTORS: Be ready to act on weakness during either Wednesday or Thursday as the oscillators approach oversold readings. This could be the beginning of another V-Shaped bottom with a short, but violent rally over the near term. You can take small bets on the following leveraged broad-based ETFs for fast money: SSO, DDM, QLD
STOCKS NEAR OR AT THE BOTTOM: MSFT
EXCHANGE-TRADED FUNDS NEAR OR AT THE BOTTOM: IYT
Categories: Stock Market Strategy Tags: AAPL, ETF, invest, investing, investing tips, investments, money, money mastery, QQQ, SPY, stock action, stock market, stock trading, stock trading tips, stocks, tony robbins, trading, trading tips, wall street
STOCK MARKET OBSERVATIONS FOR March 29, 2015: The stock market declined for 7 trading sessions in early March. Then it declined for 7-8 days in mid-March. After declining for most of last week, the rhythm of the market implies that we should hit a short-term bottom on either Tuesday or Wednesday of this coming week. Expect the hedge funds & computers to jump the gun and cause a gap up opening when they decide it’s time to rally. So the best time to take positions for a ride back up to challenge the old highs will probably be during the last hour of trading in a quiet market.
Key underlying market indicators show the following:
***********
ADVICE TO TRADERS AND INVESTORS: The internal indicators are not quite at oversold readings so expect further weakness early in the coming week. I expect the last hour of trading to be the best time to establish positions on either Tuesday or Wednesday in the following Exchange-Traded Funds: QQQ, DIA, IWM, SPY, SSO, DDM
STOCKS NEAR OR AT THE BOTTOM: BAC, CSCO
EXCHANGE-TRADED FUNDS NEAR OR AT THE BOTTOM: XLB
Categories: Stock Market Strategy Tags: AAPL, ETF, invest, investing, investing tips, investments, money, money mastery, QQQ, SPY, stock action, stock market, stock trading, stock trading tips, stocks, tony robbins, trading, trading tips, wall street