STOCK MARKET STRATEGY FOR JANUARY 6, 2019: The stock market has made several radical intraday moves in the last month that has been unnerving to many traders and investors like myself. At the present time, the internal indicators have moved into “overbought” territory and can remain there for another one to two days before trending lower. This means that a short-term top can be anticipated after a few more days of advance.
Key underlying short-term timing indicators show the following:
***********
THE BOTTOM LINE: The Fear/Greed Index is currently reading 16 or “Extreme Fear.” But this is a far stronger reading than the “2” reading of December 24th, just before the December 26th bottom. This suggests that the market can still move in either direction but has much more room to the upside. Based on the indicators and cycles, I’d anticipate a few more days to the upside before there is an attempt to retest the December 26 or January 3rd bottoms.
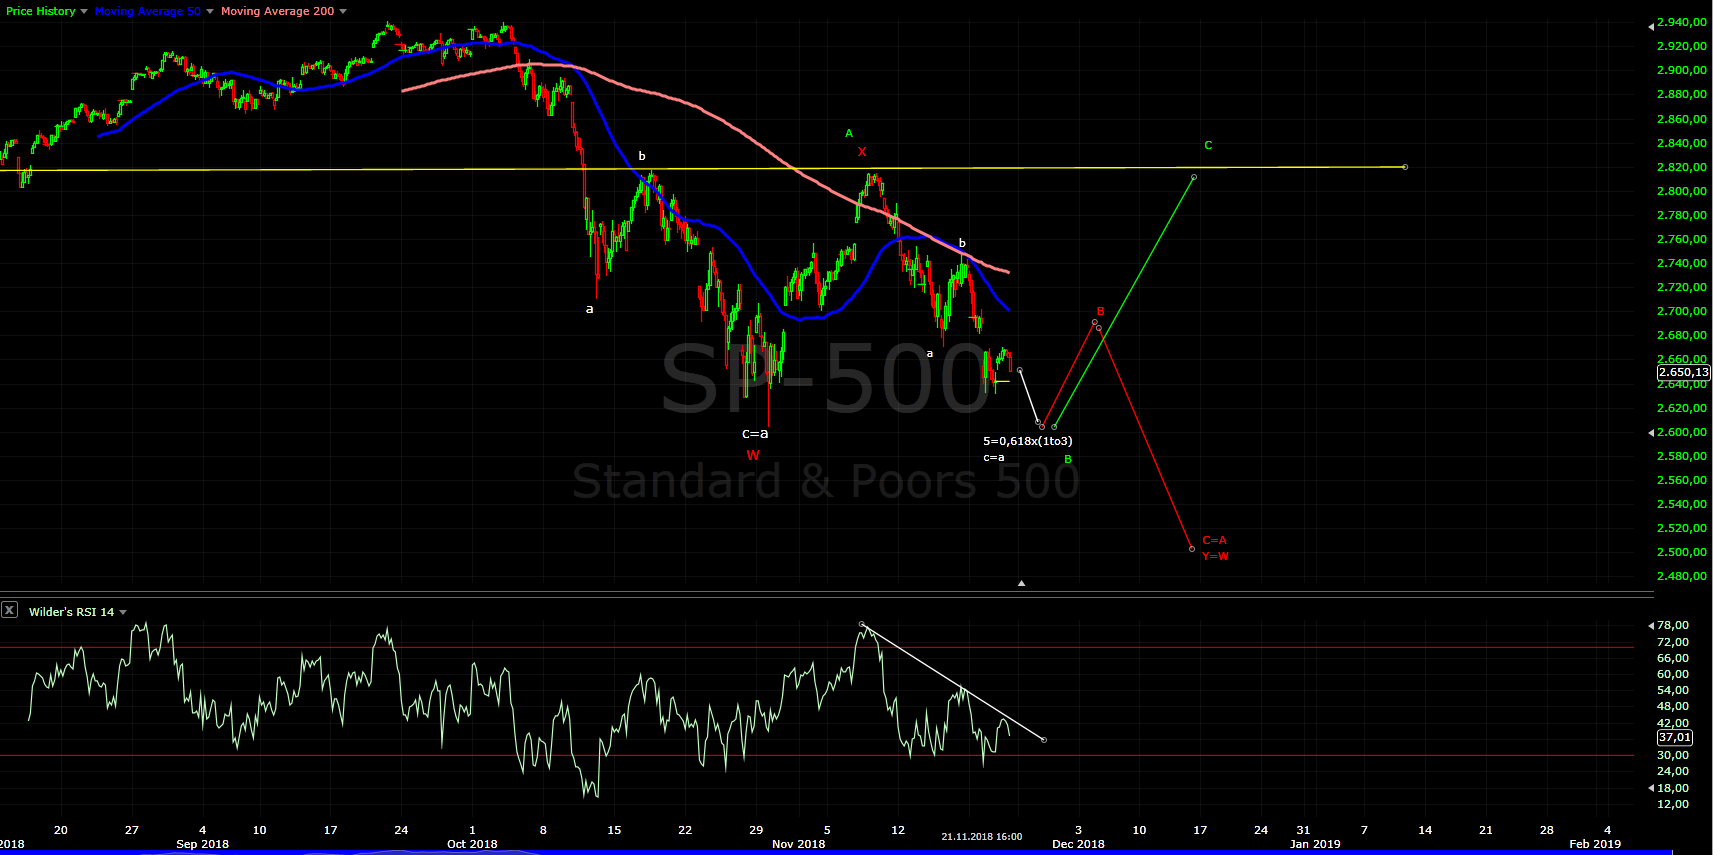
STOCK MARKET STRATEGY FOR DECEMBER 25, 2018: The stock market gave us one chance to get out on Wednesday morning before the Fed’s announcement. But after the Chairman Powell’s briefing, the market tanked hard on the remainder of Wednesday, Thursday, Friday and Monday of Christmas Eve Day. Needless to say, there was no “Santa Claus Rally” and investors are in total shock mode right now. As the internal indicators show, this is a gradual “crash” up to now and when it finally stops is anyone’s guess.
Key underlying short-term timing indicators show the following:
***********
THE BOTTOM LINE: The Fear/Greed Index is currently reading 2 or “Extreme Fear.” This confirms the action of the internal indicators above and suggests that we are near an internal low for the market. We may get a short and sharp rally soon, but in all likelihood we should see another visit to the established lows. It may take a classic “crash” in order for the market to finally hit bottom and reverse its downward trend. And with the most recent figures, that is going to take an intraday drop exceeding 1000 Dow points which is going to be scary. If I had to guess, I’d say that a rally should start on Friday December 28th after tax-selling season finally ends.
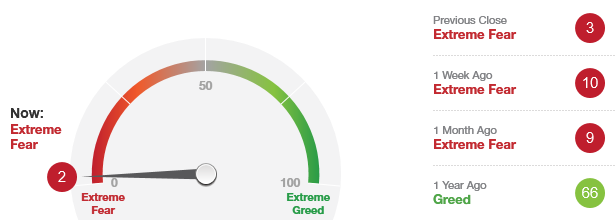 The “Fear/Greed Sentiment Index: What Emotion is Driving the Market Now?” has a current reading of “2” which is the lowest number since this indicator’s inception. This suggests that market sentiment is at levels last seen in the 2008-2009 bear market. However, this doesn’t necessarily mean that the market is ready to go up just now. But what this does do is potentially indicate the location of the “internal bottom” of the market. The “external bottom” or lowest Dow Jones Industrial Average closing price will likely follow 2-5 weeks later. On this second “external bottom” there will be many non-confirmations to show it’s a final bottom. This type of set-up won’t happen until January.
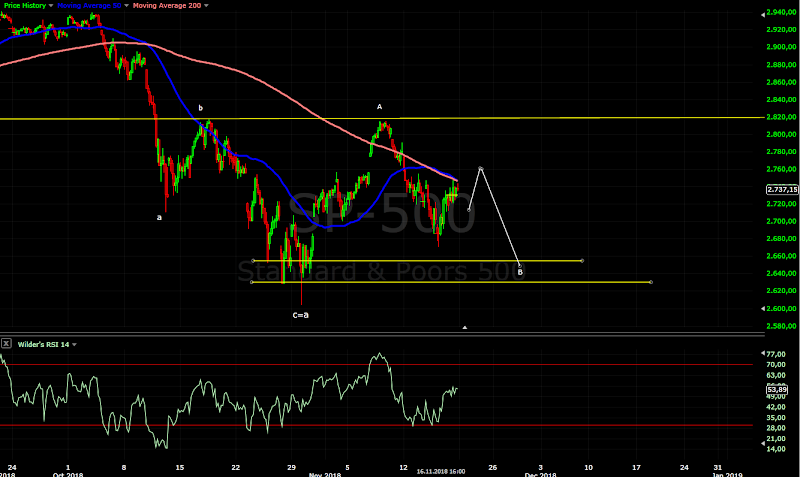
STOCK MARKET STRATEGY FOR DECEMBER 16, 2018: The stock market continued its downward move by closing at its lows for this correction. With the majority of internal indicators showing readings in the 30s, a short-term bottom can be expected on Monday or Tuesday. That should set up the market for its anticipated “Santa Claus Rally.”
Key underlying short-term timing indicators show the following:
***********
THE BOTTOM LINE: The Fear/Greed Index is currently reading 8 or “Extreme Fear.” This single digit reading after two months of “Extreme Fear” readings overall is sufficient to indicate that the general market is unloved and the sentiment has been severe enough it both duration and direction. This sets up the market for a year-end rally starting sometime between Tuesday and Thursday of this week.
Note: Thursday would match the recent 18-day cycle of lows from October 29 to November 23 in terms of number of trading days. Tuesday would mark the matching number of calendar days. Thus, a cyclical low can be anticipated between Tuesday and Thursday of this week. But remember that it will be tricky catching the exact bottom for it may mean trying to catch a “falling knife.”
STOCK MARKET OBSERVATIONS FOR January 6, 2014: The stock market may have reached its internal high on New Years Eve. A new closing high 5 to 10 trading days after that date could very easily be the final external high for this major rally. But with most professional traders sitting out last week, the stock market can still do almost anything in either direction this coming week. Expect at least one more new high in January to occur before any kind of significant decline begins.
Key underlying market indicators show the following:
My advice for traders and investors is to remain of the sidelines and let the market set itself up for the next major move. The internal indicators have mostly moved back into neutral readings after the declines on Thursday and Friday. The current list of oversold Blue Chips stocks and Exchange-Trade Funds that are near the lower range of their Money Flow Indicator and should be monitored on further weakness include: Apple , IEF, and MSFT. With such a short list of buying candidates, it implies that the market needs to correct further before moving to the upside.