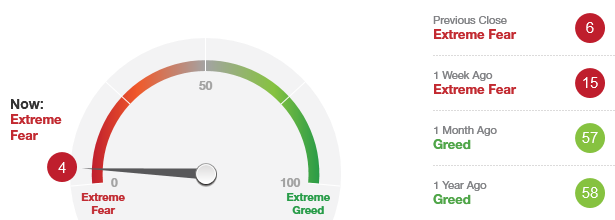
 The “Fear/Greed Sentiment Index: What Emotion is Driving the Market Now?” has a current reading of “4” which indicates that we are in the area of an “Extreme Fear” buy signal. This is only one criteria for a trading bottom but an important one. The December 24, 2018 bottom had a reading of “2” so we are in that rare general area. Any reading below this is probably worth a trade to the long side. This indicator does not stay in this area for very long.
Categories: Fear & Greed Index, Stock Market Strategy, Stock Market Timing Tags: invest, investing, investing tips, investments, retirement, SPY, stock action, stock market, stock market timing, stock trading
 STOCK MARKET STRATEGY FOR MARCH 7, 2020: The stock market made a key low on Friday February 28th and has had a choppy bounce since them. A retest of that low is taking place right now and there is a good chance that any weakness from here would represent a buying opportunity for a short-term trade. But buying into weakness with the current news background will take nerves of steel because the retest could fail as well.
Key underlying short-term timing indicators show the following:
***********
THE BOTTOM LINE: The stock market may be in a position to rally strongly after some short term weaknesses. But this is not a certainty and the low may not hold with prices continuing downwards on another leg. For many swing traders and investors, this may be an opportunity to pass on or play very lightly.
Categories: Stock Market Strategy, Stock Market Timing Tags: invest, investing, investing tips, investments, retirement, SPY, stock action, stock market, stock market timing, stock trading, stock trading tips
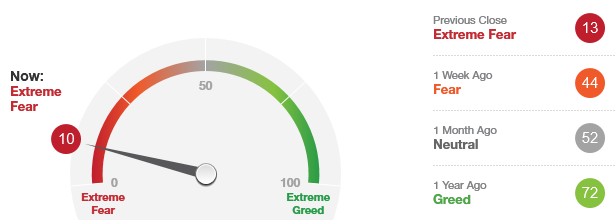 The “Fear/Greed Sentiment Index: What Emotion is Driving the Market Now?” has a current reading of “10” which indicates that we are in the area of an “Extreme Fear” buy signal. This is only one criteria for a trading bottom and it could easily go down further. An “Extreme Fear” reading of “2” occurred at the December 2018 bottom. So be careful here. There is still room for more downside and the stretching of this indicator.
STOCK MARKET STRATEGY FOR FEBRUARY 23, 2020: The stock market experienced a broad decline over the past week. In the process, many internal indicators are now trending down towards a possible low and buying opportunity in the near term. The question will be whether this bounce is worth buying or not. At this time, it is hard to determine if the current downtrend will gather momentum or not.
Key underlying short-term timing indicators show the following:
***********
THE BOTTOM LINE: The stock market is trending down into a likely bounce towards the end of next week. For the quick and nimble, it might be worth playing this bounce for a quick gain. But for others, it might be wise to let the market determine the true strength of this decline and whether it’s simply better to sit on the sidelines for awhile.
Categories: Stock Market Strategy, Stock Market Timing Tags: invest, investing, investing tips, investments, retirement, SPY, stock action, stock market, stock market timing, stock trading, stock trading tips
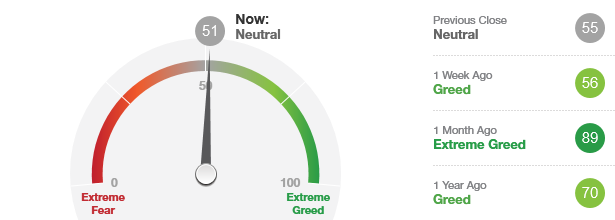 The “Fear/Greed Sentiment Index: What Emotion is Driving the Market Now?” has a current reading of “51” which indicates that we are quite possibly traversing the range towards an “Extreme Fear” buy signal. With the current strength in the markets, I would only expect this indicator to briefly touch the under “30” reading. It should then explode higher.
Categories: Fear & Greed Index, Stock Market Strategy, Stock Market Timing Tags: invest, investing, investing tips, investments, retirement, SPY, stock action, stock market, stock market timing, stock trading
STOCK MARKET STRATEGY FOR FEBRUARY 8, 2020: The major indices in the stock market (Dow, S&P, Nasdaq) all hit historic highs on January 17, 2020. A sharp decline followed with a bottom on January 31st. Then a rally ensued with new highs claimed on Thursday February 6. The time period between the two highs 14 trading sessions. This pattern could qualify as a classic “Joe Granville Top” with February 6th being the external top of the Bull Market and the “Obvious Cover Story” being the end of the Impeachment Trial and a seemingly clear path to a Trump Election victory.
Key underlying short-term timing indicators show the following:
***********
THE BOTTOM LINE: The stock market may have hit its high for the Bull Market on Thursday February 6th with the “Obvious Good News Cover Story,” euphoria in the markets, and narrow new highs & crazy action in glamour tech stocks like Tesla. This would be a good time to “take the money and run” or lighten up on overextended, overvalued positions. Note: This most recent new all-time high was quietly achieved without any mention of it being a final top of the market. The bears appear to have given up predicting the final top. We shall see…..
Categories: Stock Market Strategy, Stock Market Timing Tags: invest, investing, investing tips, investments, retirement, SPY, stock action, stock market, stock market timing, stock trading, stock trading tips
STOCK MARKET STRATEGY FOR JANUARY 5, 2020: The major indices in the stock market (Dow, S&P, Nasdaq) all hit historic highs on January 2, 2020. Given the current geopolitical backdrop, that day could prove to be the classic “internal high” according to the late stock market technician, Joseph E. Granville. What typically follows is a broad decline and then a retest of the January 2nd highs. In theory, the DJIA would close at a new high (“external high”) that is not confirmed by the majority of other indicators and indices. The time frame was usually 2-5 weeks in the previous era of stock market trading history.
Key underlying short-term timing indicators show the following:
***********
THE BOTTOM LINE: The stock market may be forming a classic “Joe Granville Top.” This formation takes about 2-5 weeks to form and will give longs one last chance to exit the market before the next significant decline begins. Of course, this is theory but history has a funny way to repeating itself for those who are unaware or unbalanced in their thinking towards technical analysis.
Categories: Stock Market Strategy, Stock Market Timing Tags: invest, investing, investing tips, investments, retirement, SPY, stock action, stock market, stock market timing, stock trading, stock trading tips
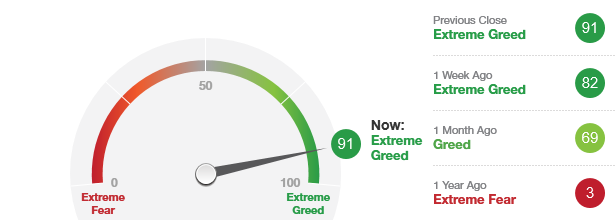 The “Fear/Greed Sentiment Index: What Emotion is Driving the Market Now?” has a current reading of “91” which indicates that we are in the area of a top. Keep in mind that more often than not, the final top or ideal sell point occurs when this indicator is above a reading of “90.” While this does not mean it is a time to short the market, it does mean that it is not the time to buy.
Categories: Fear & Greed Index, Stock Market Strategy, Stock Market Timing Tags: invest, investing, investing tips, investments, retirement, SPY, stock action, stock market, stock market timing, stock trading
STOCK MARKET STRATEGY FOR NOVEMBER 28, 2019: The major indices in the stock market (Dow, S&P, Nasdaq) all hits consecutive historic highs for three days in a row on declining volume. A similar situation happened in reverse back in August of 1982 when the general market quietly exhausted all selling at its final inflation-adjusted all-time low. Could this be the ultimate top? Have the last short-sellers finally thrown in the towel? Isn’t it a coincidence that this is happening on a holiday, too?
Key underlying short-term timing indicators show the following:
***********
THE BOTTOM LINE: The stock market is quietly making new all-time highs as complacency has set in on a seemingly never-ending relentless advance. But my senses tell me that the top is close at hand and a move to the sidelines is most likely the smartest move to make right now.
Categories: Stock Market Strategy, Stock Market Timing Tags: invest, investing, investing tips, investments, retirement, SPY, stock action, stock market, stock market timing, stock trading, stock trading tips
STOCK MARKET STRATEGY FOR OCTOBER 26, 2019: The stock market has been rallying for 4 weeks now in a narrow channel suggesting a change of direction soon. With the internal indicators having reached “overbought” territory during this past week, I’d expect a move down the next few days with a setup for one last run to new highs before the late Fall volatility returns to finish the year.
Key underlying short-term timing indicators show the following:
***********
THE BOTTOM LINE: The stock market has already made an internal top with the market likely to dip for a few days before going to new highs during the second week on November. Be ready for a quick dip buy point this coming week for a ride up.
Categories: Stock Market Strategy, Stock Market Timing Tags: invest, investing, investing tips, investments, retirement, SPY, stock action, stock market, stock market timing, stock trading, stock trading tips, stocks