STOCK MARKET STRATEGY FOR JULY 14, 2018: The market presented a tricky, short-term trading opportunity on July 3rd. It came from a semi-oversold condition which suggests that the rally will not be strong. So far, it appears as if the market can still go in either direction with the same degree of certainty. This is a time to be on the sidelines waiting for the next opportunity to set up. The Volatility Indicator will have to traverse across its oscillator from “overbought” to “oversold” which will probably take over a week to happen.
Key underlying short-term timing indicators show the following:
***********
THE BOTTOM LINE: The Fear/Greed Index is currently reading 47 or “neutral.” I’m still awaiting for a quick move into the “Extremely Fear” area in order to feel like the conditions are ripe for a more sustainable rally. So, we continue to wait for a better trading opportunity to the upside.
Categories: Stock Market Strategy Tags: AAPL, buy low sell high, ETF, invest, investing, investing tips, market timing, money, QQQ, stock market timing, stock market trading tips, stock trading tips, stocks, wall street
STOCK MARKET STRATEGY FOR MAY 19, 2018: The internal indicators of the stock market have been trending down the last few days, chewing up time, and possibly setting itself up for another trading bottom as early as late next week. Another plausible scenario is for next week to produce a bounce with a more stable bottom about two weeks out. In any event, there is nothing to do but wait for the next set-up and that can only happen with a bout of bad news.
Key underlying short-term timing indicators show the following:
***********
THE BOTTOM LINE: The Fear/Greed Index is currently reading 52 or “Neutral.” This doesn’t really tell you anything except that it has probably seen the worst in terms of extreme negative sentiment. One more quick trip to the “Extreme Fear” area will probably be all that it takes for another tradable intermediate term bottom.
Categories: Stock Market Strategy Tags: insurance, investing, investments, money, retirement, stock market, stock market timing, stock trading, stocks, tony robbins, trading, wall street
STOCK MARKET STRATEGY FOR APRIL 28, 2018: The stock market may be setting itself up for an intermediate-term bottom next week. The internal breadth indicators below are all close to oversold readings and additional weakness is sure to trigger buy signals. If a decline next week starts to materialize, then look at it as an opportunity to go long and ignore the “bad news” that has to happen in order to create the public selling. The trick will be if this happens mostly on Friday when it will take more guts to make trading commitments over an uncertain weekend.
Key underlying short-term timing indicators show the following:
***********
THE BOTTOM LINE: The Fear/Greed Index is currently reading 40 or “Fear.” This reading is after it has been in the “Extreme Fear” range for many weeks. I would expect a brief one or two day return to the “Extreme Fear” zone to coincide with a new intermediate buy signal on any weakness next week. If so, this “correction” will have scared enough weak hands out of the long game with only strong hands left to ride the next rally up. Of course, if we rally straight up from here then this scenario goes out the window and the deck will be “shuffled” once again.
Categories: Stock Market Strategy Tags: insurance, investing, investments, money, retirement, stock market, stock market timing, stock trading, stocks, tony robbins, trading, wall street
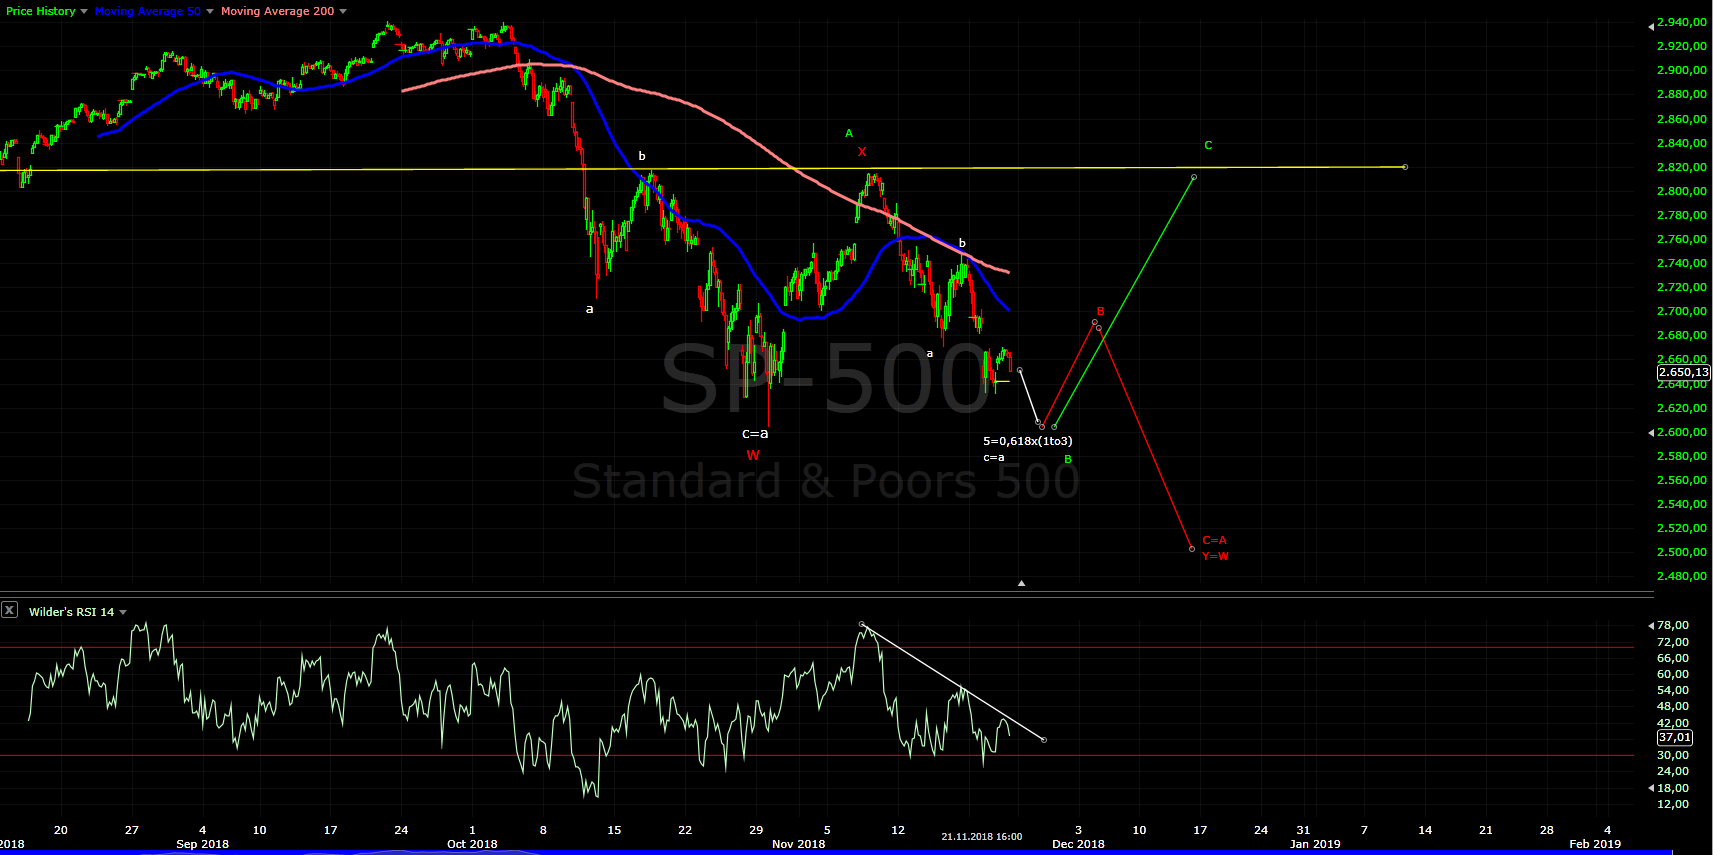
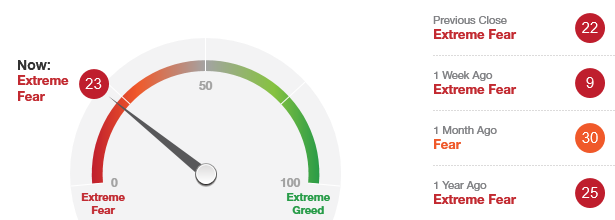 The “Fear/Greed Sentiment Index: What Emotion is Driving the Market Now?” has a current reading of 23 which is in the “Extreme Fear” zone. This suggests that the market is in a buying range and not a selling range. Tactically, this means that you should either buy or hold depending on your situation.
This indicator has remained in the “Extreme Fear” area for an abnormally long time. I would guess that it will leave this “oversold” area shortly and not return for some time. (After perhaps, one more spike down)
I would look to buy on any 2 to 3 day weakness that is accompanied by “obvious bad news” as the cover story for a good bottom in the market. I think that the next retest of the recent bottoms will be successful and that a sharp rally should follow. The only trick will be if the weakness occurs on a Friday where traders will have to sweat out the weekend of potentially more bad news.
Categories: Fear & Greed Index Tags: insurance, investing, investments, money, retirement, stock market, stock market timing, stock trading, stocks, tony robbins, trading, wall street
STOCK MARKET STRATEGY FOR MARCH 25, 2018: The stock market is setting itself up for a climatic bottom over the short-term. Breadth indicators are in “oversold” territory with the chance of become even more oversold if the market should sell-off on Monday-Tuesday. While a market panic is difficult to buy into, it may still be the proper strategy for buying low and selling high. But the proper to tactic would be to buy in smaller increments spread over 3-5 days during periods of weakness. This takes discipline that few amateurs possess.
Key underlying short-term timing indicators show the following:
***********
THE BOTTOM LINE: The Fear/Greed Index is currently reading 7 or “Extreme Fear.” With any weakness on Monday, this indicator will have the lowest reading in several years indicating a potential intermediate term bottom. To spread the risk, a wise trader should buy a combination of diversified broad-based ETFs and strong Blue-Chip dividend-paying stocks (example: Exxon, Microsoft, Apple, Wells Fargo). The first step would be to buy on extreme weakness in small pilot positions and add gradually. If a market panic should occur, it may take a few days for the market to stabilize or bounce. And then there is the possibility of a final wave down which a trader must be anticipate when conditions become so extreme as they are now.
Categories: Uncategorized Tags: insurance, investing, investments, money, retirement, stock market, stock market timing, stock trading, stocks, tony robbins, trading, wall street
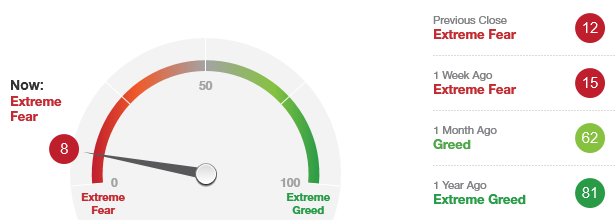 The “Fear/Greed Sentiment Index: What Emotion is Driving the Market Now?” reading has a current reading of 8 which is well into the “Extreme Fear” zone. This suggests that the market is in a buying range and not a selling range. Tactically, this means that you should either buy or hold depending on your situation.
This indicator has remained in the “Extreme Fear” area for several weeks now. This is very abnormal and suggests that we have corrected long enough in terms of time. But the charts of the major indexes don’t appear to have declined enough in terms of price.
Today’s “Extreme Fear” reading means that it’s time to start taking pilot positions if you’re under-invested in preparation for a rally to challenge the old highs. A bottom may likely appear on either Friday or Monday but actually picking that bottom will be hard to do as always. You will have sweaty palms from the fear of taking a risk here, but it’s about time for the market to get out of the “Extreme Fear” zone. It’s been here too long.
Note: This reading of 8 is the lowest of this current down cycle and may mark the bottom of this correction.
Categories: Fear & Greed Index Tags: insurance, investing, investments, money, retirement, stock market, stock market timing, stock trading, stocks, tony robbins, trading, wall street
STOCK MARKET STRATEGY FOR FEBRUARY 5, 2018: The stock market is currently “oversold” in all of the internal indicators. Therefore, the market can hit a short-term bottom as early as Tuesday. And over the past several years, the market has rebounded from similar bottoms without retesting. But what is different now is how far and long the market has advanced in the post-election period. If you want to play for a fast money trade, I’d expect a rally to come in the next 5 trading sessions and likely coincide with a bounce off of the 200-day moving average in the S&P 500.
Key underlying short-term timing indicators show the following:
***********
THE BOTTOM LINE: The Fear/Greed Index is currently reading 40 or “Greed.” I would expect the next short-term bottom to occur when this indicator is below a reading of 25 in “Extreme Fear” territory. That could happen in the next few days and be worth the risk for a quick ride up to the old highs. My favorite trading vehicle because of its diversification and low-correlation to interest rates would be the QQQ Exchange Traded Fund in the area of 148-150.
Categories: Stock Market Strategy Tags: insurance, investing, investments, money, retirement, stock market, stock market timing, stock trading, stocks, tony robbins, trading, wall street
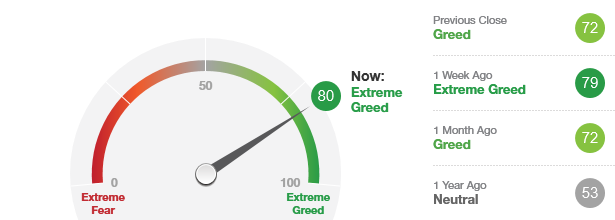
The “Fear/Greed Sentiment Index: What Emotion is Driving the Market Now?” reading has a current reading of 80 which is in the “Extreme Greed” zone. This suggests that the market is in a selling range and not a buying range. Tactically, this means that you should either sell or hold depending on your situation.
This indicator has remained in the “Extreme Greed” area for most of last week. However, this gauge was in the “neutral” zone not too long ago. But we never got into the “Fear” range with a chance to reload for this ride to the upside.
Today’s “Extreme Greed” reading means that it’s time to be on the sidelines waiting for the sentiment to become more negative and present another buying opportunity. That’s going to take a few weeks at a minimum.
Categories: Fear & Greed Index Tags: insurance, investing, investments, money, retirement, stock market, stock market timing, stock trading, stocks, tony robbins, trading, wall street