 STOCK MARKET STRATEGY FOR SEPTEMBER 23, 2017: The stock market is at the top of its price range with a few of the internal indicators in overbought territory. But other indicators show neutral readings which still allows the market to go in either direction with equal likelihood. This is one of those times where it’s probably most prudent to lighten up on over-extended positions and wait to add when the next oversold condition presents itself.
Key underlying short-term timing indicators show the following:
***********
THE BOTTOM LINE: The Fear/Greed Index is currently reading “Greed” after being in the “Extreme Greed” range for a few days last week. Many times this means that this indicator will traverse itself from an “Extreme Greed” reading back down to an “Extreme Fear” reading. But most of all, this index is saying that this is not a good time to be buying. The next week should be interesting as the general market may be setting up for an October Crash. Stay alert!
Categories: Stock Market Strategy Tags: insurance, investing, investments, money, retirement, stock market, stock market timing, stock trading, stocks, tony robbins, trading, wall street
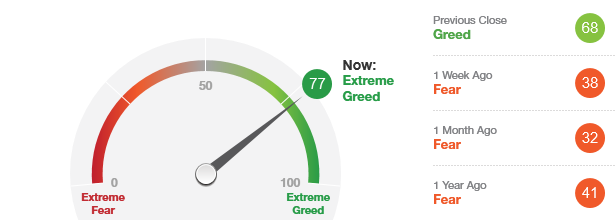
The “Fear/Greed Sentiment Index: What Emotion is Driving the Market Now?” reading is once again back in the “Extreme Greed” range after being in the “Extreme Fear” zone only a few weeks ago. At the beginning of this week, most of the internal indicators were showing “overbought” conditions. Plus, the market indices are pushing against resistance levels at the top of the price ranges.
All of these point to a time when it’s too late to buy and most likely a good time to sell or lighten up. And while this Fear/Greed Index is showing “Extreme Greed,” it can still move closer to the 90-95 range before exhausting itself to the upside.
Now is a time to start building up cash for the next buying opportunity when this indicator is back in the “Extreme Greed” area. That time is several weeks away.
Categories: Fear & Greed Index Tags: insurance, investing, investments, money, retirement, stock market, stock market timing, stock trading, stocks, tony robbins, trading, wall street
STOCK MARKET STRATEGY FOR SEPTEMBER 10, 2017: The stock market is in a sort of “no-man’s land” right now. Last week, it was in an “overbought” area and now it may be tracing out a pattern across its price range towards an “oversold” condition. With all of the internal indicators showing “neutral” readings, there is plenty of room for the market to go in either direction. But we are in the time of year when tops and bottoms can form, it would be prudent to play it safely right now and wait for a better opportunity to take shape in the coming weeks.
Key underlying short-term timing indicators show the following:
***********
THE BOTTOM LINE: The Fear/Greed Index is currently reading “Fear” after being in the “neutral” range for a few days. I wouldn’t be surprised to see this index go back into the “Extreme Fear” range before finally hitting the bottom of this sideways correction. There isn’t any immediate action that needs to take place right now. This is a time to build cash reserves in anticipation of a better buying opportunity in the coming weeks.
Categories: Stock Market Strategy Tags: insurance, investing, investments, money, retirement, stock market, stock market timing, stock trading, stocks, tony robbins, trading, wall street
STOCK MARKET STRATEGY FOR SEPTEMBER 4, 2017: The stock market finds itself at the top of its trading range once again after being in the “Extreme Fear” area of the Fear/Greed Index for several days. With all five internal indicators reading “overbought,” it is time to take some profits and refrain from buying just now. This rally probably has a few more days before it corrects. But it’s anyone’s guess whether this next dip is going to be sideways, shallow, brief or extended. This is a very tricky time of year and with all that’s going on in terms of political and tax-reform news the volatility in the market can be expected to increase significantly. Thus, you don’t want to take too many chances of being on the wrong side of the market.
Key underlying short-term timing indicators show the following:
***********
THE BOTTOM LINE: The Fear/Greed Index is currently reading “Neutral” after being in the “Extreme Fear” range for many days. Usually this marks an intermediate term bottom, but the correction has been so shallow that it’s difficult to call it anymore than a “dip.” With the market short-term overbought, it would be prudent to avoid new purchases right now. But with the market near resistance price levels, I’d be looking for obvious non-confirmations as a sign of a trend-reversal. But more than anything, this is a time to be cautious and manage your chips wisely.
Categories: Stock Market Strategy Tags: insurance, investing, investments, money, retirement, stock market, stock market timing, stock trading, stocks, tony robbins, trading, wall street

The “Fear/Greed Sentiment Index: What Emotion is Driving the Market Now?” reading is finally in the “Extreme Fear” range for the second day in a row at 17. This indicator is now suggesting that the general stock market is in a “buying opportunity” zone.
This is a minimum requirement for taking new positions in the general stock market. In the past, it is not unusual for market bottoms to occur when this index is under 10. But overall, the market is close to a bottom and it wouldn’t be such a bad idea to start taking positions on any further weakness even though your “palms are sweaty.”
But in times and opportunities like this, money management strategies are the key to success. In my book, Wall Street Craps: How to Play Today’s Hot & Cold Markets for Fast Money With Less Risk, I write about dividing your investing capital into “chips” or even blocks of money.
For example, if you have $100, divide this amount into 20 $5 chips. Your first bet might be $5 or $10 or 5% or 10% of your investing capital. So the present situation would be one where you make a first bet. This means that the present buying opportunity should only be 5%-10% of your investing or trading capital. This is because you may be a little early at this time and in steep market drops being early can be costly and dangerous.
Categories: Fear & Greed Index Tags: insurance, investing, investments, money, retirement, stock market, stock market timing, stock trading, stocks, tony robbins, trading, wall street
STOCK MARKET STRATEGY FOR AUGUST 13, 2017: The stock market has now reached short-term oversold levels according to many internal indicators. This sets up the market for a “bounce” to higher levels. If the general market advances quickly at the beginning of the week, we may get left behind as the market would have bottomed on last Thursday. But if it should decline early in the coming week, we may be presented with a short-term buying opportunity for a quick ride up to challenge the old market highs.
Key underlying short-term timing indicators show the following:
***********
THE BOTTOM LINE: The Fear/Greed Index is currently reading “Fear” which serves as a buying alert. My market discipline is that a buying opportunity is only acted upon once the Fear/Greed Index reaches “Extreme Fear” levels. That could occur early next week if the market should continue to decline. But since prices have not decline very much from the market highs, any buying will be in stocks or ETFs with only short-term (not intermediate-term) oversold readings.
This opportunity will not be the case of buying low and selling high, but more like buying high and selling higher. This is not the time for bottom-fishing, but instead is a time to buy only those issues with a high correlation to the general market. Or simply restrict your buying in S&P 500 and/or Nasdaq 100 equivalents.
Note: None of the broad-based ETFs in the major indices are currently oversold. This could mean that a better low may be coming later when these ETFs do become oversold.
Categories: Stock Market Strategy Tags: insurance, investing, investments, money, retirement, stock market, stock market timing, stock trading, stocks, tony robbins, trading, wall street
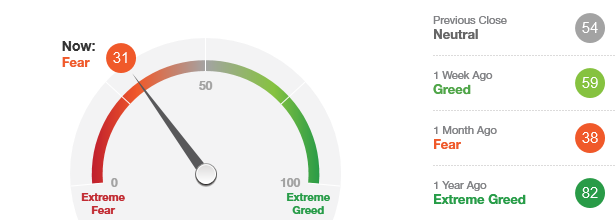
The “Fear/Greed Sentiment Index: What Emotion is Driving the Market Now?” reading is in the “Greed” range at 31. This indicator is now suggesting that the general stock market is approaching a buying opportunity. That signal will be triggered by a reading below 25 in the “Extreme Fear” zone.
Thus as far as sentiment goes, an important signal may come as early as Friday or Monday. This would be a “buy the dip” strategy which one day will prove to be wrong. But this market has been really resilient to declines and until proven otherwise, I’d expect another rally to new highs to occur when this current decline ends.
Categories: Fear & Greed Index Tags: insurance, investing, investments, money, retirement, stock market, stock market timing, stock trading, stocks, tony robbins, trading, wall street
STOCK MARKET STRATEGY FOR JULY 29, 2017: The stock market has corrected internally while not giving much in price as evidenced by the near oversold readings in the 5 indicators listed below. This suggests that another rally could be coming soon after another drop next week. But with the large decline in the Dow Jones Transportation Average last week, I’d be careful about taking larger permanent positions. The next set-up to the upside will likely be a sharp quick rally at best.
Key underlying short-term timing indicators show the following:
***********
THE BOTTOM LINE: The Fear/Greed Index is currently reading “Greed” after being in the “Extreme Greed” range for 3 days last week. This suggests that there is enough euphoria among market participants to warrant extreme caution. But with the internal indicators that I follow approaching “oversold” readings, I’d be looking for any decline in the next few days to be only temporary. This could be just another “dip” worth buying in this seemingly endless Bull Market.
Categories: Stock Market Strategy Tags: insurance, investing, investments, money, retirement, stock market, stock market timing, stock trading, stocks, tony robbins, trading, wall street
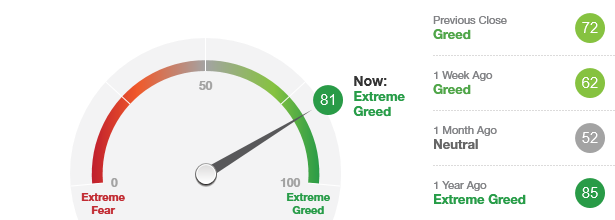
The “Fear/Greed Sentiment Index: What Emotion is Driving the Market Now?” reading is in the “Extreme Greed” range at 81. This indicator is now suggesting that the general stock market is in the danger zone. This means that it’s not the time to buy in order to go long equities. Instead, it’s a probably best to lightened up on extended positions and reduce your risk.
And while the market may correct, bottom, and return to this same price level, it’s usually prudent to begin taking your gains especially when the sentiment is overextended like it is now. When the technicals and the sentiment confirm each other, it’s smart to anticipate an immediate trend change. That doesn’t necessarily mean going short because that in itself is a whole different game to play for most.
Note: A chapter in my book, Wall Street Craps: How to Play Today’s Hot & Cold Stock Market for Fast Money With Less Risk, deals with the unexpected unique challenges of playing the short vs. the traditional long game of stock market investing & the dangers of leveraged short Exchange-Traded Funds.
Categories: Fear & Greed Index Tags: insurance, investing, investments, money, retirement, stock market, stock market timing, stock trading, stocks, tony robbins, trading, wall street
 The “Fear/Greed Sentiment Index: What Emotion is Driving the Market Now?” reading is in the “Greed” range at 64. This indicator leaves room for the market to rally further until it reaches unsafe territory in the “Extreme Greed” area.
A few weeks ago, this indicator gave a one-day reading of 25 in the “Extreme Fear” range. That proved to be the bottom in retrospect as this bull market continues to power through. With that in mind, it’s probably wise to avoid any short positions and await the next oversold reading in the breadth oscillators or an “Extreme Fear” reading below 26 in the Fear/Greed Sentiment Index in order to take additional long positions.
But at this point, taking profits would not be such an unwise thing to do in anticipation of the next sharp downdraft with seems likely to occur after an “obvious” piece of good public news (like the passing of the new health act).
Categories: Fear & Greed Index Tags: insurance, investing, investments, money, retirement, stock market, stock market timing, stock trading, stocks, tony robbins, trading, wall street