The stock market has made a strong rebound from the deeply oversold bottom from late February’s invasion day. But that momentum appears to be waning with the prospect of more weakness over the near-term. The internal indicators are in middle ground suggesting that the general market is not deeply oversold or overbought. Therefore, the short-term market direction is up for grabs. With the general climate of the market, I would favor a retest of the late February lows with enough bad news to scare the weak Bulls to capitulate. That climatic bottom could come in the next 5-8 trading sessions.
Key underlying short-term timing indicators show the following:
NYSE McClellan Summation Index: This indicator is still bottoming after a long decline for many weeks now, but it is starting to turn up. This points to a possible intermediate term bottom or powerful bounce in the making.
Fear/Greed Index: This popular indicator is in the “Extreme Fear” territory with a reading of 17. It has taken a lot of time to get this index into the “Extreme Fear” range, but it now has the possibility of going to the sub-5 reading that has often marked the bottom of major moves in the recent past. This index is telling us to get ready for a possible buy signal on a scary retest of the February lows.
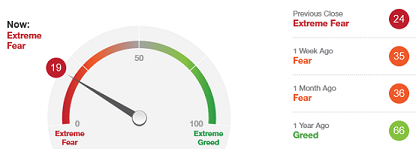
The Fear & Greed Index moved strongly into “Extreme Fear” territory today with a reading of 19. Solid intermediate-term bottoms have occurred when this indicator gets as low as 2 or 3. There is a chance that this indicator is setting up for such an occurrence during next week. That provides enough time for more bad news to hit bullish investors into dumping their holdings at the bottom in a brief period of maximum fear.
The stock market had an extremely memorable shorten week with the invasion of Ukraine news backdrop. After a climatic bottom on Thursday’s opening, the market rallied strongly during the remainder of the day and on the following Friday. It was a classic bad news bottom and many are wondering if that was THE BOTTOM or whether there will be a retest in the coming weeks. These are turbulent times and for those with a weak stock market stomach, this may be a time to sit on the sidelines. Another good time to go long could be on a retest of last week’s low.
Key underlying short-term timing indicators show the following:
NYSE McClellan Summation Index: This indicator has been bottoming after a long decline for many weeks now. It is hard to see any reliable signal here as it may still fall off the cliff and go to a lower bottoming level. But overall, it says that the risk is in trying to short this market as strange as that may seen.
Fear/Greed Index: This popular indicator is only in the “Fear” territory with a reading of 31. At the December 2018 bottom, this indicator reached a reading of 3. This week it reach an “Extreme Fear” reading of 25 which is just barely in this territory. I would expect a much lower reading if this is to be the final bottom and gives me the strong conviction that we still have more downside to go.
The stock market had a highly volatile week ending with a strong rally on Friday. Monday appeared to be a climatic low with several retests during the week. Unless you were an experienced day-trader, it would have been a difficult week to trade. It feels like the sentiment is strongly negative with bad news dominating the headlines. Friday’s rally may just be the fact that too many investors were on the negative side of the equation. I would expect there to be continued volatility and not a market for most investors to participate in unless in small amounts for the fun of it.
Key underlying short-term timing indicators show the following:
NYSE McClellan Summation Index: This indicator has been declining for some time and usually needs a cluster to dots in the bottoming area before advancing. But when it turns after a cluster, it should be a sustained rally upwards.
Fear/Greed Index: This popular indicator is only in the “Fear” territory with a reading of 36. At the December 2018 bottom, this indicator reached a reading of 3. It is amazing to me that it is this high and did not come close to an “Extreme Fear” reading this week. That makes me very cautious about the current rally that started on Friday and maybe the market needs another leg down to make this indicator have lower readings.
The stock market had a rocky start to 2022. With several non-confirmations during the last week of December, it is not surprising that there would be problems this week. With that being said, the general market could stay in this range without a major move in either direction. But with the large percentage losses in many of last year’s dynamic growth stocks, the background is set for a final plunge for these shares. However, there aren’t any signs of capitulation that would mark that final bottom. So for now, I would recommend keeping your powder dry and resist the temptation of going long until we see more signs of extreme behavior/sentiment.
Key underlying short-term timing indicators show the following:
NYSE McClellan Summation Index: This indicator has rallied from its December 20th low and is in the process of clustering at a peak before heading lower again. A tradable bottom usually isn’t signaled unless the clustering starts after a sustained move down. That point is still weeks away in time.
Fear/Greed Index: This popular indicator is in the “Neutral” territory with a reading of 52. At the December 2018 bottom, this indicator reached a reading of 3. So we are a long way away from a swing trade to the upside. A minimum reading of 25 is required to reach the “Extreme Fear” range.
The stock market had a volatile week with large movements in both directions. But under the surface, many stocks experienced large retracements from their all-time highs. With the negative news backdrop of the new COVID strain and larger than expected inflation projections, the market is ripe for a crash and reversal this coming week. If you’ve been waiting for an opportunity to make some fast money, this week may be your week. But this next rally may be a narrow advance so I’d stick with large-cap stocks like those in the Dow Jones Industrial Average.
Key underlying short-term timing indicators show the following:
NYSE McClellan Summation Index: This indicator has broken down and has a current oversold reading of 15. It satisfies the requirement of a bottom condition, but usually needs a cluster of readings in the lower area before rallying for a new up leg.
Fear/Greed Index: This popular indicator is in the “Extreme Fear” territory with a reading of 20. At the December 2018 bottom, this indicator reached a reading of 3. But overall, this indicator is sufficiently oversold to support a bounce upwards.
The stock market turned down sharply on Friday and is now heading towards a possible bounce around the SPY 89-day moving average at 448. With the negative news build-up over the long weekend, we could easily have a panic crash on Monday. In any case, a sharp short bounce worth trading to the upside can be expected early next week. But what happens over the intermediate term is anyone’s guess. Another problem is the widespread expectation of a Santa Claus Rally which may be a dangerous assumption. You need to remember the alternative case of December 2018.
Key underlying short-term timing indicators show the following:
NYSE McClellan Summation Index: This indicator has broken down and is one trading day away from a possible “oversold” condition. In the past, this indicator has shown the ability to stay oversold for many days, but recently the bottom of the market has occurred shortly after entering this oversold territory. So be ready to move soon if you’re willing to risk playing the trading game.
Fear/Greed Index: This popular indicator is in the “Fear” territory after having been in the “Greed” area for some time. Friday’s sharp down took this indicator down quickly from a reading of 64 to 31 which is the largest one-day drop that I can ever recall. One or two more negative days and this indicator will be in the “Extreme Fear” range which is a precondition for a bottom.
The stock market has been correcting and chewing up time since its recent move to all-time highs. In the meantime, three of the short-term oscillators have flashed “oversold” readings suggesting that a short-term bottom is here now. This may be setting the market up for one last rally into December before any major correction occurs. You could start taking positions on any weakness during the next few days or sell any remaining positions into strength as the market continues to climb the proverbial “wall of worry.”
Key underlying short-term timing indicators show the following:
NYSE McClellan Summation Index: This indicator has been clustering in the overbought range, but is now breaking down and headed across its Ultimate Indicator oscillator’s range towards the “oversold” area. According to the history of this indicator, it will need some clustering at a lower level before a sustainable rally can happen. What I’d expect instead would be a short, sharp rally to new all-time highs in December, but not one of duration.
Fear/Greed Index: This popular indicator is in the “Greed” territory after having been in the “Extreme Greed” area for some time.. One has to be very careful about taking long positions at this time even though the short-term oscillators are “oversold.” Bottoms usually don’t occur unless this indicator has a reading of 25 or less (Extreme Fear).
The stock market has been doing a great job of “climbing the wall of worry.” On Thursday of this past week, many short-term indicators topped out and the evaluation is whether it did so from: 1) exhaustion & a move down across the trading range or 2) just a pause before resuming its relentless climb. Unfortunately, no one really knows despite what they may claim with almost total certainty. I would look for either a decline and then a failed retest or a high volume reversal before making any bets to the downside. Sometimes it’s just better to watch from the sidelines and preserve your capital (chips).
Key underlying short-term timing indicators show the following:
Fear/Greed Index: This popular indicator is in the “Greed” territory with a reading of 67 after being in the “Extreme Greed” zone for a day or so. This indicator gave a one-day buy signal in early October, but it is not a reliable timing tool for catching tops. Therefore, it’s not worth reading too much into its reading this coming week.
The stock market traded lower for most of the week that coincided with the turmoil in Afghanistan. With the rally on Friday, the Dow Jone Industrial Average is about 500 points below its August 16th high. I would expect a rally to new highs to be unconfirmed by the majority of other indicators. That would set up a Dow Theory Sell Signal as well as a Granville Sell Signal worth shorting or selling existing long positions. Such a scenario could take place in the next 3-7 trading sessions so be on your toes for this developing opportunity.
Key underlying short-term timing indicators show the following:
Fear/Greed Index: This popular indicator is in the “Extreme Fear” territory with a reading of 25 after being in the “Extreme Fear” zone with a reading of 22 on Thursday. The best buy signals on major corrections have occurred when the reading gets below 10, however.
Monday August 23rd Note: The Granville Sell Signal usually occurs when the new unconfirmed high in the Dow Jones Industrial Average coincides with an obvious public good news cover story. Could the Pfizer COVID vaccine FDA approval be that cover story?
Neither the information nor the opinions expressed should be construed as a solicitation to buy or sell any Exchange-Traded Fund, stock, option, mutual fund, currency or commodity. Past performance is not necessarily indicative of future results. You may lose money trading and investing. Trade at your own discretion: we don't share in your profits, so we don't share in your losses. We may have a financial interest in one or more of the securities discussed in this blog. Investors should obtain the advice of a qualified investment advisor before entering into any transactions. This blog serves as an educational and entertainment website only. We are not Registered Investment Advisors and do not in any way claim to be either.